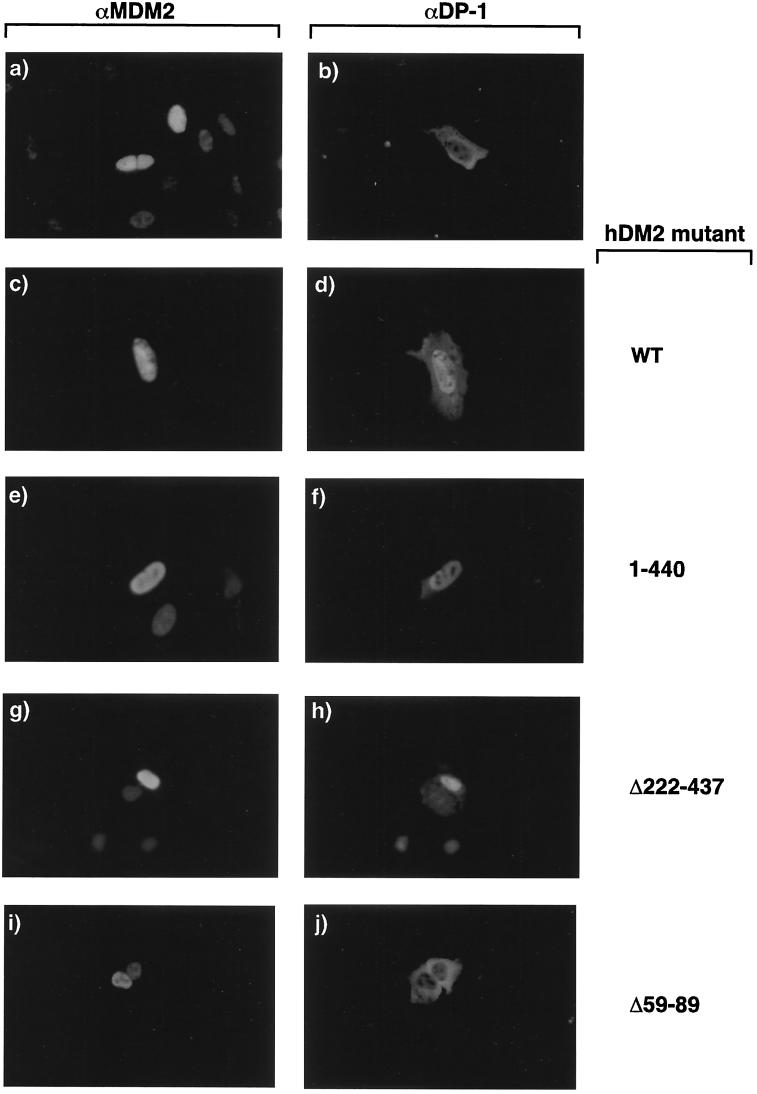
FIG. 7.
Influence of hDM2 on the intracellular distribution of DP-1. The intracellular distribution of the indicated proteins was determined under apoptotic conditions after SAOS2 cells were transfected with expression vectors encoding hDM2 (6 μg) (a), DP-1 (6 μg) (b), or both hDM2 and DP-1 (6 μg each) (c, d, e, f, g, and h). The cells were treated as described in the text with anti-DP-1 (b, d, f, g, and h) and anti-MDM2 (a, c, e, g, and i). Panels a and b show different cells, whereas panels c and d, e and f, g and h, and i and j show the same cells stained with anti-MDM2 and anti DP-1, respectively; note that the images result from different exposure times. The hDM2 mutant derivatives are indicated. Similar results were obtained with U20S cells (data not shown).

