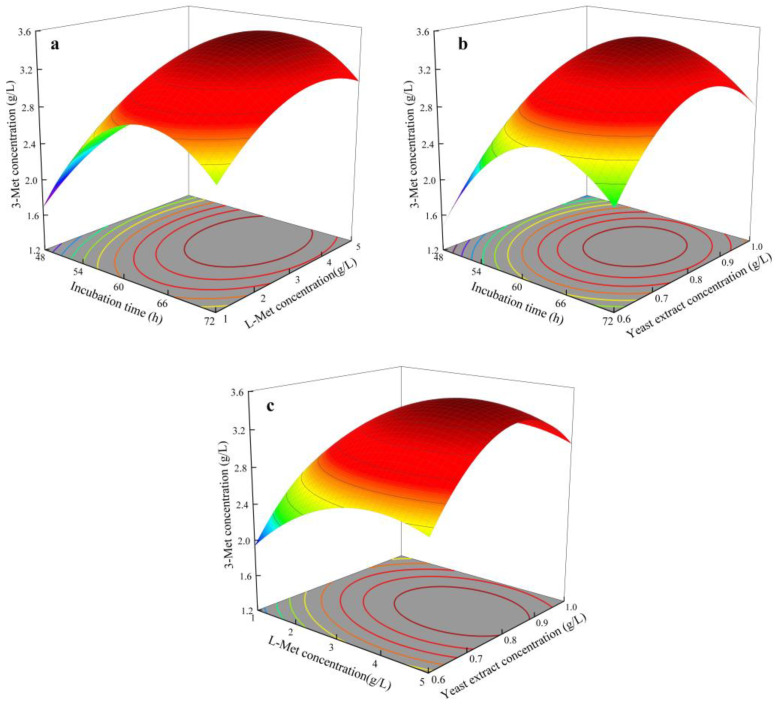
Figure 4.
Response surface and contour map of the interaction of various factors affecting the yield of 3-Methylthiopropanol. (a) interaction between incubation time and L-Met concentration; (b) interaction between incubation time and yeast extract concentration; (c) interaction between L-Met concentration and yeast extract concentration. The colour change from blue to red corresponds to increase in responses.

