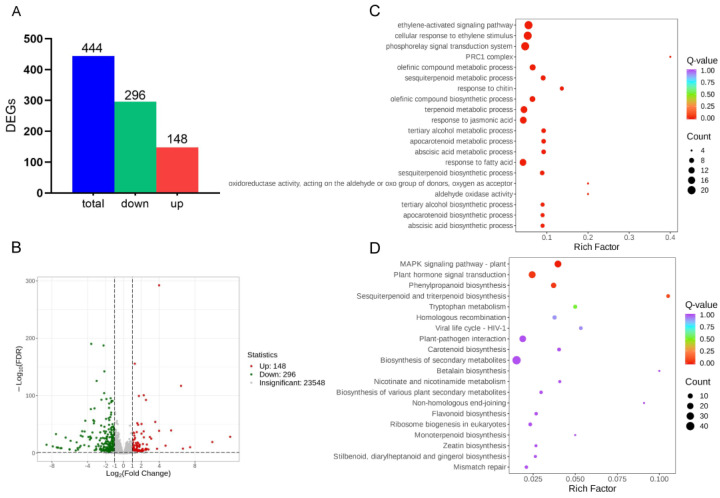
Figure 2.
The RNA-seq results show that the zmnac17-1 mutation led to expression changes in some genes. (A) The differentially expressed genes between the B73 wild type and the zmnac17-1 mutant. (B) DEG volcano map, where the red dots represent the up-regulated genes in zmnac17-1, the green dots represent the down-regulated genes, and the gray dots represent the non-differentially expressed genes. (C) GO enrichment top 20 scatter plot, where the ordinate represents the GO entry, and the abscissa represents the rich factor. (D) KEGG enrichment top 20 scatter plot, where the ordinate represents the KEGG path, and the abscissa represents the rich factor.

