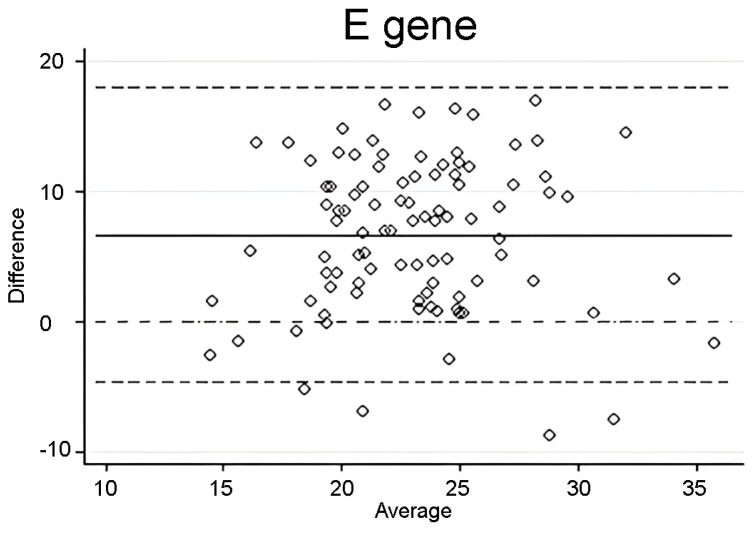
Figure 3.
Bland-Altman assessment was conducted on CT values obtained for the SARS-CoV-2 E gene from saliva and nasopharyngeal swab samples collected within a 24 h timeframe. The dashed lines indicate the limits of agreement, while the solid line represents the mean difference between the measurements.

