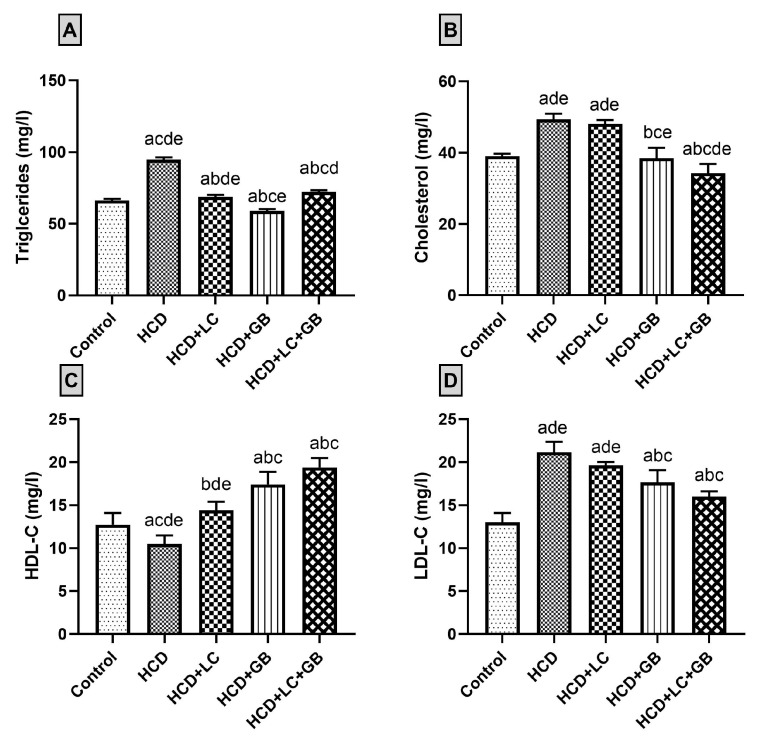
Figure 1.
(A–D) Lipid profile charts. All values are expressed as the mean ± SD (n = 6). Triglycerides (A), cholesterol (B), HDL-C ((C) high-density lipoprotein cholesterol), and LDL-C ((D) low-density lipoprotein cholesterol) are shown. The letters a–d and e indicate significant differences (p-value < 0.05) between groups in comparison with the control, HCD, HCD + LC, HCD + GB, and HCD + LC + GB groups, respectively.

