Figure 5.
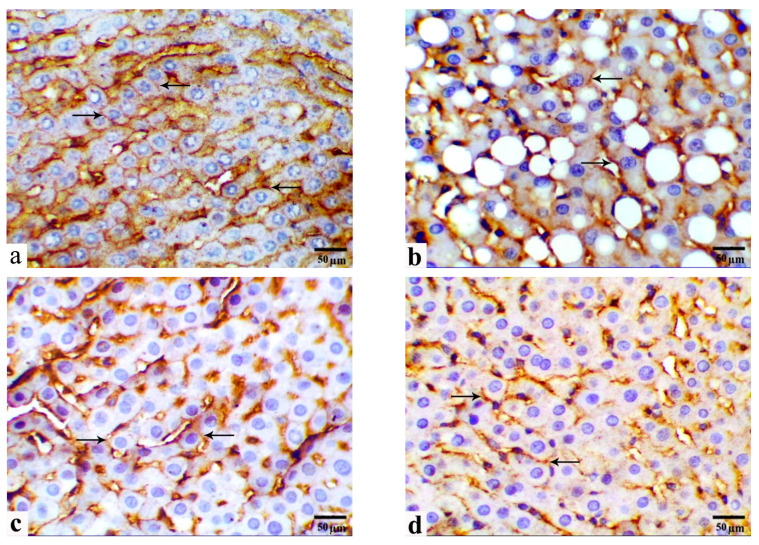
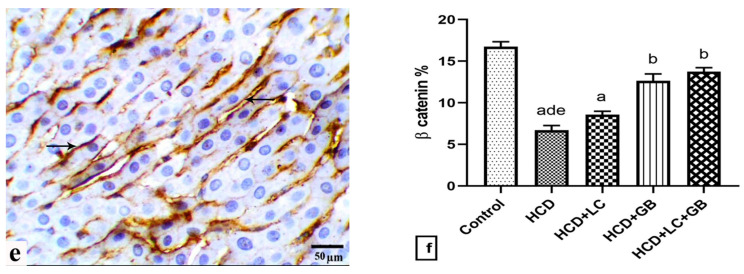
(a–f) Photomicrographs obtained from IHC liver sections of control rats ((a)/G1), HCD-fed rats ((b)/G2), HCD + LC-fed rats ((c)/G3), HCD + GB-fed rats ((d)/G4), and HCD + LC + GB-fed rats ((e)/G5) showing β-catenin expression (arrows). Scale bar, 50 µm. (f) The graph shows the semiquantitative scoring of the percentage of positive staining; the results are presented as the mean ± SD, with a sample size of n = 6. The letters on columns a–e indicate significant differences (p-value < 0.05) between groups and the control, HCD, HCD + LC, HCD + GB, and HCD + LC + GB groups, respectively. IHC, magnification 40×, scale bar 50 µm.


