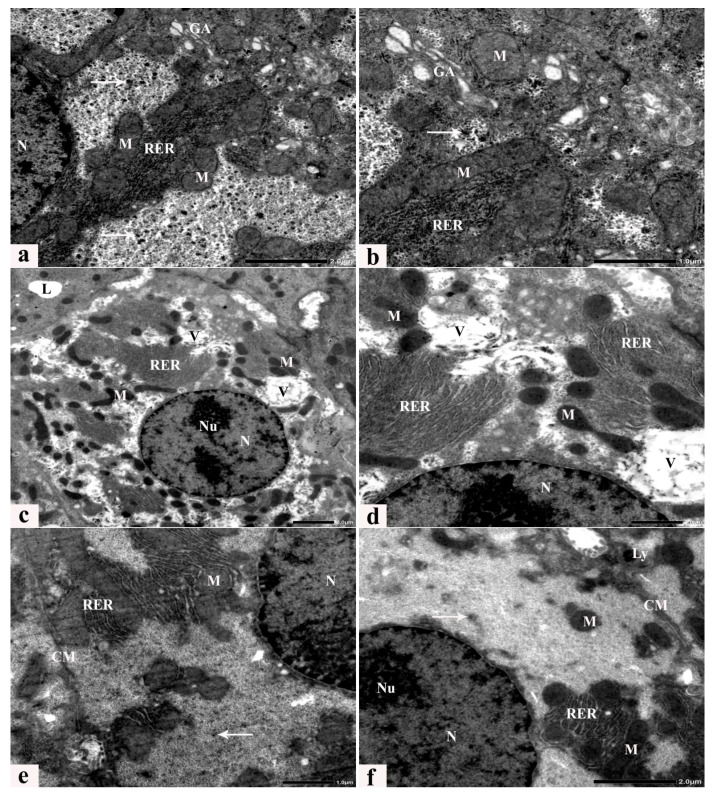
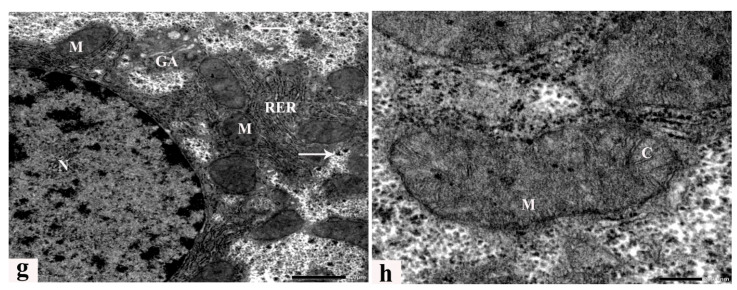
Figure 7.
(a–h) Electron micrographs of a hepatocyte from a control rat (a,b), an HCD-fed rat (c,d), and animals that received HCD + LC (e), HCD + GB (f), and HCD + LC + GB (g,h) showing the cell membrane (CM), nucleus (N), nucleolus (NU), rough endoplasmic reticulum (rER), Golgi apparatus (GA), mitochondria (M), cristae (C), glycogen rosettes (arrows), lysosomes (LY), degenerated lytic cytoplasm with large vacuoles (V), Uranvl acetate, and lead citrate stain.


