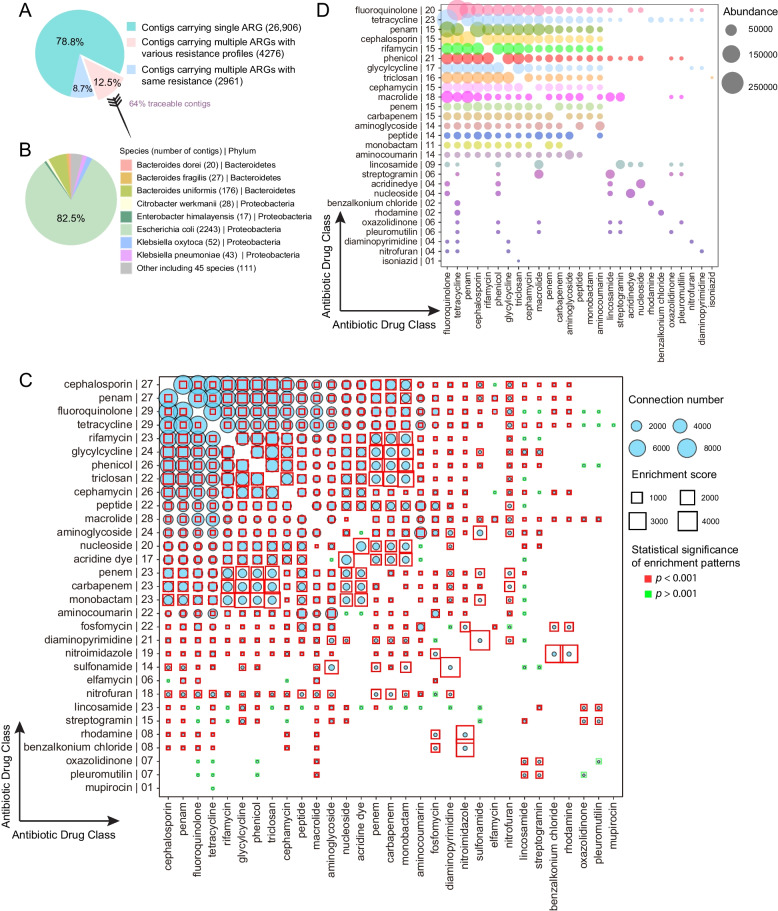
Fig. 1.
Overview of co-selection between ARGs in the infant gut. A Proportion of contigs carrying different numbers of ARGs. B Taxonomic origin of contigs carrying multiple ARGs with different resistance profiles. C Co-localization bubble chart representing the drug classes related to different ARGs. The number of connections between ARGs targeting different drug classes in the contigs, and the associated enrichment scores, are shown in the figure. On the y-axis, the number to the right of the name indicates the number of other drug classes represented in the co-localization arrangements. The size of the bubble indicates the number of connections in the contigs. The enrichment scores higher than 1 are indicative of enrichment in that co-localization arrangement. A binomial test with FDR adjustment was used to test the statistical significance of enrichment patterns (p < 0.001 was set as the significance cutoff; red square frame represents p < 0.001 and blue square frame represents p > 0.001). A significant p value indicates that the occurrence of that specific pattern of gene co-localization would not be expected by chance. The size of the square frame represents the magnitude of the enrichment score. D The bubble chart represents the drug classes targeted by 167 MDR ARGs. The size of the bubble is proportional to the abundance of MDR ARGs potentially conferred resistance to two drug classes. On the y-axis, the number to the right of the name indicates the number of other drug classes represented in the co-localization arrangements.

