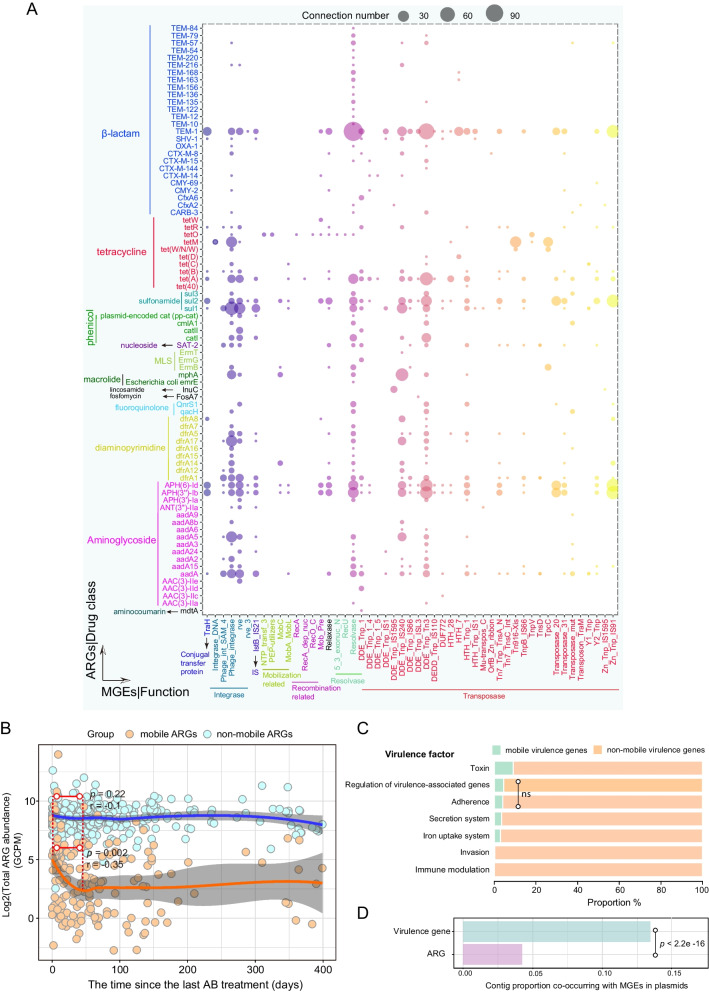
Fig. 5.
Co-localization of ARGs, BRGs/VGs, and MGEs on plasmids in the infant gut. A Co-localization bubble chart representing ARGs and MGEs in plasmid contigs. The size of the bubble is proportional to the number of connections in the contigs. B The effects of antibiotic treatment on log-transformed total abundance of mobile ARGs and non-mobile ARGs with time. The confidence interval for the slope of the linear regression line is shown. Orange and blue dots represent the 311 infants who received antibiotics in the first year. Infants lacking detectable mobile ARGs are not represented in the figure. The X coordinate represents the time of the most recent antibiotic treatment prior to sampling for each infant. The significance level and Pearson correlation coefficient R are shown in the figure; dotted lines denote the window in which the Pearson correlation was calculated (from 0 to 45 days). AB represents antibiotics. C The relative proportions of mobile and non-mobile VGs related to seven virulence factors. Pairwise Fisher's exact test was carried out for the comparison of the relative proportions of mobile and non-mobile genes within each of the seven groups. Multiple comparisons were adjusted for FDR. Except for the pairwise comparison of adherence- and regulation-associated genes (p = 0.06, indicated by ns), there were significant differences between all paired comparisons (p < 0.001). D The proportion of all contigs with ARGs/VGs and MGEs that were found in plasmids. p value from Fisher’s exact test is shown in the figure

