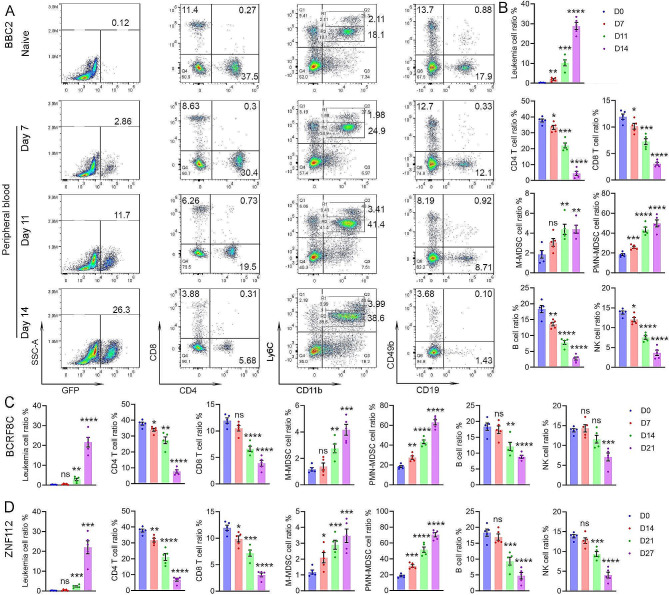
Fig. 1.
Flow cytometry monitoring of the major immune cells during SCLL development. Representative flow diagrams of peripheral blood (PB) samples from naive mice (A) give the baseline levels of CD4 + and CD8+, T-cells, Ly6C + CD11b + myeloid cells as well as CD19 + B-cells and CD49b + NK cells. When the same markers are analysed in PB samples from mice which have been engrafted with BBC2 SCLL cells, there is a progressive decrease in the number of T-, B- and NK cells over 7 days (D7-D14) and a progressive increase in the number of Ly6C + CD11b + cells. While the Ly6ChiCD11b + cell population (M-MDSC) shows only a modest increase, the proportion of Ly6CintD11b + PMN-MDSC show a highly significant increase. Leukemic cells are defined by the expression of GFP. The mean of the percentage changes in the various cell types across all five mice in each cohort (indicated by the colored dots) defines consistent changes (B). When a similar analysis is performed in mice engrafted with AML-like BCRF8C SCLL cells (C) or T-cell leukemic ZNF112 SCLL cells (D), the same distribution of the different immune cells across the time scale is consistently seen. In all cases a two-way comparison between the naïve and leukemic mice was performed using the student’s t-test providing the relative significances; ns = not significant, * p < 0.01, ** p < 0,001, *** p = 0.0001, **** p = < 0.00001. The longer time periods of sampling in (C) and (D) reflects a slower progression of disease in these models

