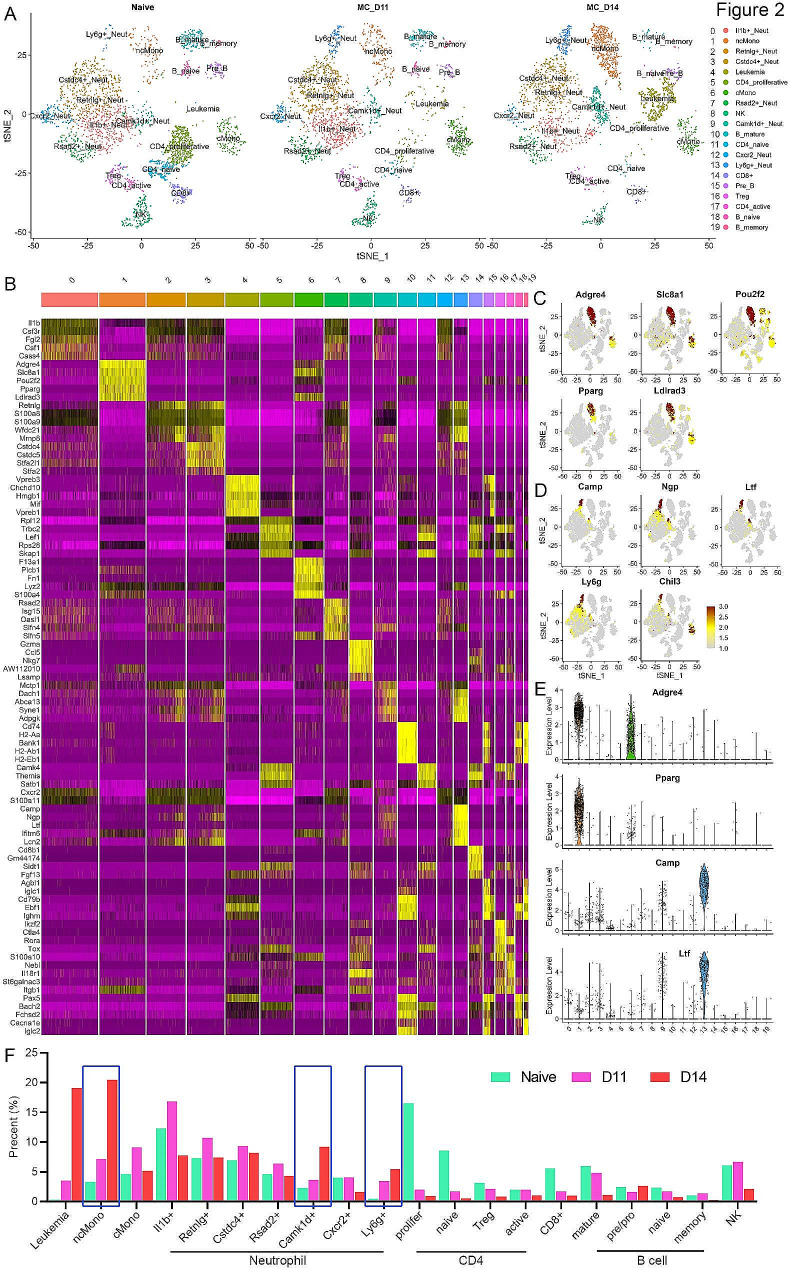
Fig. 2.
Single cell profiling of the immune cell composition during SCLL progression. tSNE distribution of cells in the PB from naive and BBC2 (D11 and D14) engrafted mice (A) identified 20 distinct clusters, which are annotated based on their specific gene expression profiles as shown in the heatmap in (B), the 5 most statistically significant genes as defined by the FindAllMarkers function. Feature plots for selected genes relative to the tSNE profile shown in (A), clearly show their predominant or specific expression in the non-classical monocyte cluster (C) and in the Ly6g + neutrophils (D). Analysis of the relative number of cells in each cluster expressing individual genes shows their distinct expression levels in violin plots for selected genes (E). Relative increases and decreases in the proportion of cells in the different clusters as a result of the progression of leukemia in the mouse cohorts are shown in (F), where the blue boxes highlight the increases seen in specific monocyte and neutrophil populations

