Fig. 3.
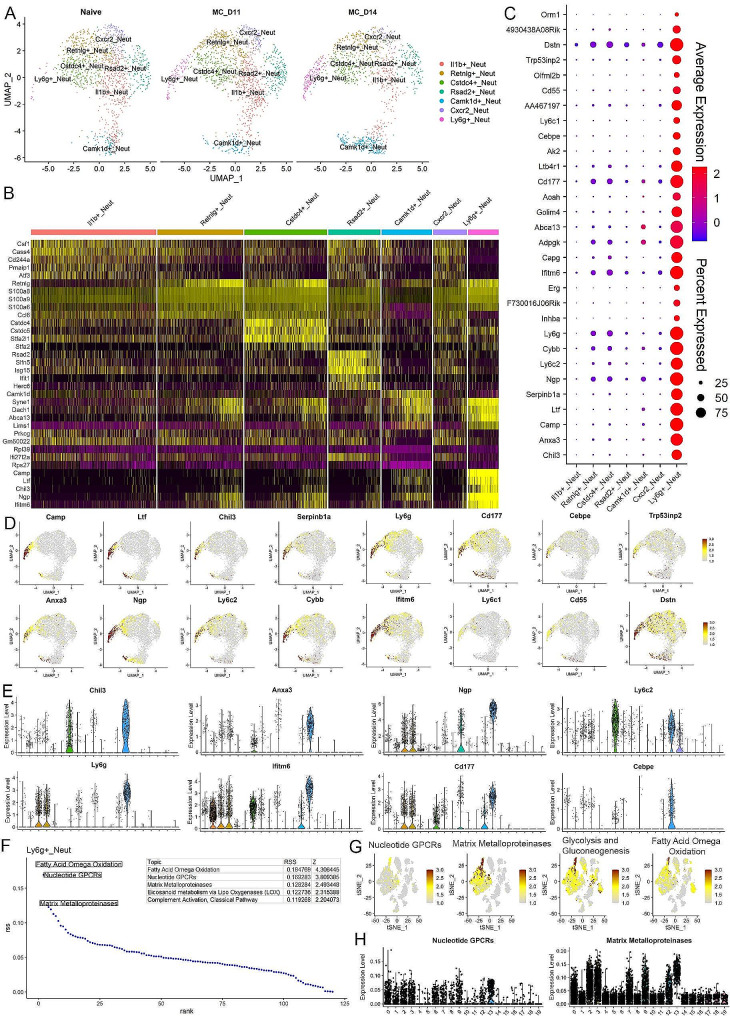
Molecular characterization of leukemia induced neutrophils. UMAP profile (A) of clusters specifically representing different subpopulations of neutrophils in mice engrafted with BBC2 cells (D11 and D14) compared with naive mice shows the dynamic changes of different subclusters, with predominant increase of the Ly6g + and Camk1d + subpopulations. The heatmap in (B) shows the top five markers identified in each subgroup based on the neutrophil-only analysis. While some profiles show the expression of identified markers is specific to the particular cluster, there is also overlap between closely related clusters. When the expression patterns of the 30 most statistically significant markers identified in the Ly6g + neutrophils are examined across all neutrophil cluster (C), most of these genes are highly specific for Ly6g + cells while some of them are expressed at lower levels in the other neutrophil clusters. The specificity of some of these identified markers for the Ly6g + cluster is shown in the feature plots in (D), with some displaying shared expression between the Ly6g + and Camk1d + clusters. Expression levels of selected markers across all clusters are shown in the violin plots in (E). Analysis of enriched Wikipathways in the Ly6g + cells identifies the five most upregulated pathways (F) including the matrix metalloproteinases. This preferential activation of the MMP pathway in the Ly6g + cells is confirmed in the feature plots (G) and violin plots (H)

