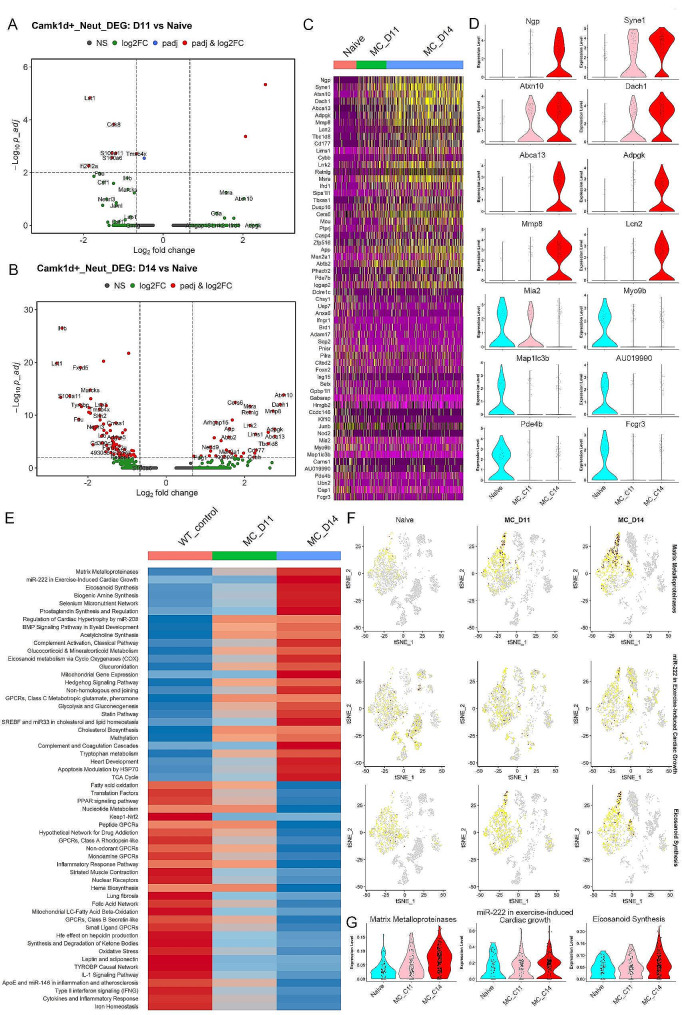
Fig. 4.
Transcriptional reprogramming in leukemia-induced neutrophils during leukemia development. Volcano plots show the differentially expressed genes (DEGs) in the Camk1d + neutrophils at Day 11 (A) and Day 14 (B), compared with their naïve counterparts. When these DEGs are plotted in a heatmap for expression levels (C), a clear view of upregulated and downregulated pattern is seen during leukemia progression. Examples of genes that appear to be specifically upregulated and downregulated as leukemia progresses is shown in the violin plots in (D). Analysis of the Wikipathways identified the matrix metalloproteinases pathway with the highest activation score during leukemia development (E). These observations are further confirmed in the feature (F) and violin (G) plots.

