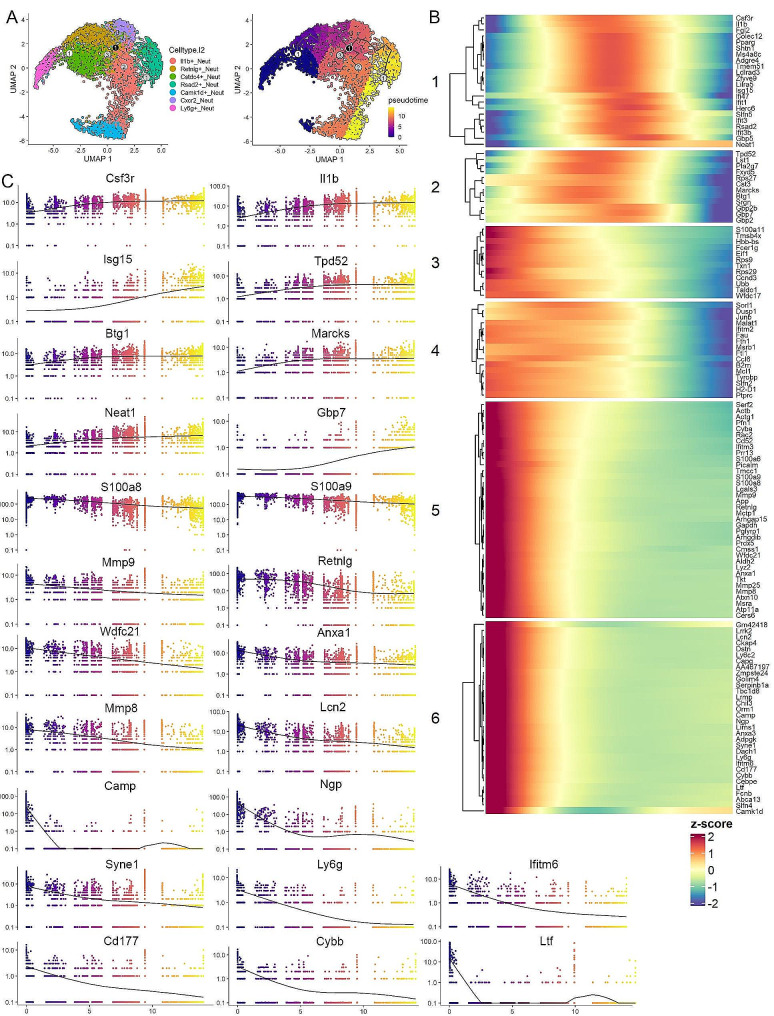
Fig. 5.
Trajectory analysis of the potential differentiation path of leukemia induced neutrophils. UMAP distinction of neutrophil populations is shown in (A, left). Pseudotime estimates of differentiation waves across the neutrophil populations is shown in (A, right), where the progress is tracked from the Ly6g + neutrophils across various subpopulations. The branchpoint is shown in the black filled ‘1’ and branches are then defined as 1–3 marked with gray circles. The identified module genes across the pseudotime continuum are subdivided into 6 subgroups depending on the patterns of gene expression changes (B). An analysis of the variance of specific genes in individual cells using RSS are presented in (C), with the color coding defining the timing of expression changes across the pseudotime continuum.

