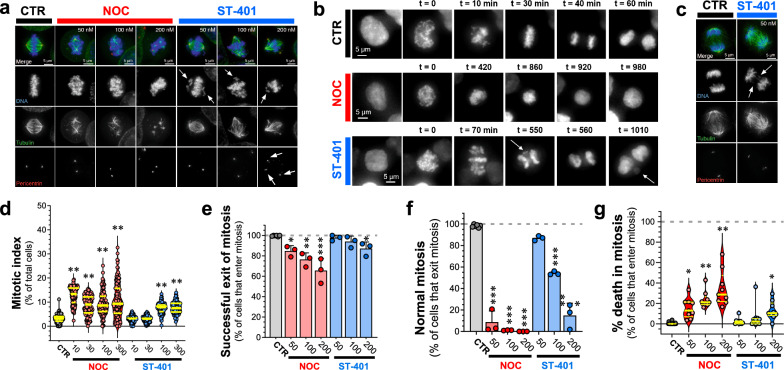
Fig. 2.
NOC profoundly disrupted the mitotic spindle and mitosis, whereas ST-401 predominantly left mitotic MT polymer intact, which enables mitotic exit. a Immunofluorescence images of HCT116 cells in mitosis after a 4 h treatment with either DMSO, NOC or ST-401. DNA was stained with DAPI (blue), MTs with an anti-tubulin antibody (green) and centrosomes with anti-pericentrin antibody (red). NOC had a more disruptive effect on spindles than ST-401. NOC eliminated a large amount of the MT polymer in the spindles. ST-401 cells showed congression defects (see arrows in DNA channel) and multipolar spindles at 200 nM (pericentrin channel). b HCT116 cells expressing histone H2B fused to mCherry were imaged for 24 h using live fluorescence microscopy in the presence of either vehicle or drugs (see Methods). The nuclear envelope breakdown to anaphase (or DNA decondensation) timing for CTR cells occurred around 40 min, while NOC (100 nM) and ST (100 nM) required several hours to exit mitosis. The NOC-treated HCT116 cell in this example exited mitosis without cytokinesis (just DNA decondensation without cell division, 920 min timepoint). The ST-401-treated HCT116 cells in this example presented congression problems (70 min time point) and lagging chromosomes in anaphase that become micronuclei (arrows in 550 min and 1010 min panels). c Immunofluorescence image of mitotic cells in anaphase after DMSO or ST-401 (50 nM) treatments. The immunofluorescence was performed as in panel a. ST-401 cells presented lagging chromosomes during anaphase (arrows). d Immunofluorescence of cells treated with DMSO, NOC or ST-401 for 24 h were analyzed to calculate the mitotic index (percentage of mitotic cells in a population). DAPI, anti-tubulin antibody and anti-pericentrin antibody were used to detect mitotic structures. We used CellProfiler to identify cells and its machine learning companion CellProfiler Analyst to quantify mitotic cells. NOC yielded a higher mitotic index at all concentrations after 24 h, while ST-401 induced such responses at 100 and 300 nM. For every condition, we recorded 50 random fields with a ×10 objective and an 18 mm diameter coverslip. Every spot in the graph corresponds to a field of view, and 3 independent experiments were performed and analyzed. e HCT116 cells tagged with H2B-mCherry were imaged for 24 h in the presence of either DMSO, NOC or ST-401. Most ST-401 treated cells exit mitosis, while a higher percentage of cells in NOC die during mitosis. Data are shown as mean ± s.e.m. of three independent experiments where a total of 2075 mitotic cells for ST-401 and 3317 mitotic cells for NOC were analyzed. f Of those cells that exit mitosis and exhibit feature of normal mitosis in the presence of NOC and ST-401 shown in e, ST-401 treatment of HCT116 cells at increasing concentrations resulted in a higher percentage of cells that exit mitosis without major defects as compared to NOC. g Of those cells that enter mitosis, NOC caused a higher percentage of cell death in mitosis at all concentrations. Statistics (d-g): ***P < 0.001, **P < 0.01 and *P < 0.05 significantly different from corresponding CTR (Two-way ANOVA followed by Dunnett’s). For each, n = 3 independent experiments

