Fig. 3.
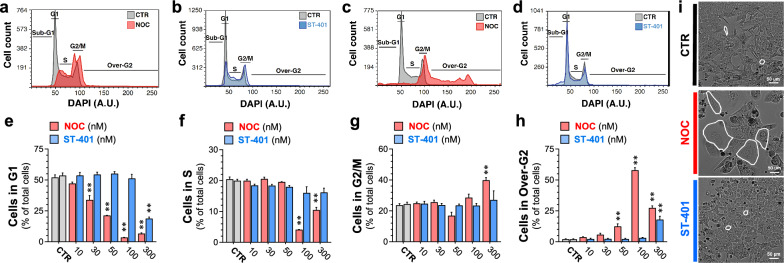
Differential cell cycle responses: NOC treatment resulted in the development of polyploid cells while ST-401 treatment did not. a–d Representative cell cycle plots of HCT116 cells treated with NOC (100 nM) and ST-401 (100 nM) for 4 h (a-b) or for 24 h (c, d). NOC increased the number of cells in G2/M after 4 h and in Over-G2 after 24 h, indicating the formation of polyploid cells, while ST-401-treated HCT116 cells underwent an unperturbed cell cycle (b). e–h Quantification of the number of HCT116 cells in each cell cycle phase when treated with DMSO (CTR) or with increasing concentrations of NOC and ST-401 for 24 h. NOC induced mitotic arrest and increased the number of polyploid cells at concentrations > 50 nM, whereas ST-401 induced this response only at 300 nM. Statistics (e–h) Data are expressed as mean ± s.e.m. of n = 3 independent experiments. **P < 0.01 significantly different from corresponding CTR (Two-way ANOVA followed by Dunnett’s). i Representative bright field images of cells treated with NOC (100 nM) and ST-401 (100 nM) for 5 days. At the same concentration, NOC induced the formation of large polyploid cells

