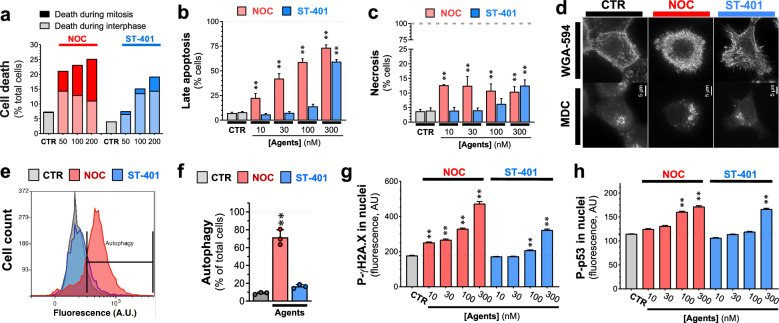
Fig. 4.
ST-401 kills preferentially in interphase whereas NOC kills preferentially in mitosis and induces apoptosis, autophagy, and necrosis. a Live-cell microscopy imaging of HCT116 cells treated with NOC and ST-401 for 24 h. NOC treatment results in comparable amounts of cell death in mitosis and interphase, while ST-401 treatment results in cells dying more frequently in interphase. Statistics (a). Data are shown as % of total cells from 3 independent experiments (5500 cells for ST-401 and 7200 cells for NOC). b, c HCT116 cells treated for 3 days with the MTAs, harvested, and labeled with PI/annexin V to measure apoptosis and necrosis using flow cytometry. NOC dose-dependently and gradually increases apoptosis levels whereas ST-401 induces an all-or-nothing increase in apoptosis at 300 nM. Statistics (b, c) Data are expressed as mean of 3 independent experiments with > 10,000 cells. Ordinary one-way ANOVA analysis. **P < 0.01 significantly different from corresponding CTR. d, f HCT116 cells stained with monodansylcadaverine (MDC) to detect autophagosomes in HCT116 cells treated with vehicle (CTR), NOC (100 nM) or ST-401 (100 nM) for 24 h. Fluorescence microscopy image of HCT116 cells (d). Flow cytometry histogram of MDC fluorescence (e). Quantification of MDC fluorescence by flow cytometry (f). NOC induces autophagy whereas ST-401 does not. Statistics (e, f): Data are expressed as mean ± s.e.m. of n = 3 independent experiments. **P < 0.01 significantly different from corresponding CTR (Two-way ANOVA followed by Dunnett’s). **P < 0.01 significantly different from corresponding CTR. g, h HCT116 cells were treated vehicle (CTR), NOC (100 nM) or ST-401 (100 nM) for 24 h, immunostained for P-γH2AX and P-P53, imaged by fluorescence microscopy and pixel intensity analyzed. NOC increased the levels of both P-H2AX (g) P-P53 (h) in the nucleus in a concentration-dependent manner, whereas ST-401 only induced such response at higher concentrations. Statistics (g, h): Data are shown as median with 95% CI for 3 independent experiments where 23,000 and 10,000 total cells were measured for ST-401 and NOC, respectively. Ordinary one-way ANOVA analysis. **P < 0.01 significantly different from corresponding CTR

