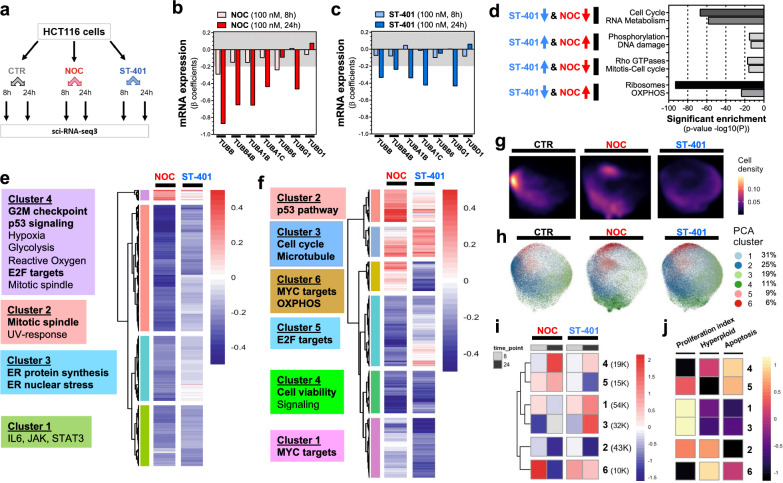
Fig. 5.
ST-401 and NOC treatment induce differential gene expression and cell states. a Chart depicting the sample structure of our single-cell RNA-seq analysis of NOC and ST-401 exposed HCT116 cells. b, c Change in mRNAs that encode for tubulin subunits following 8 and 24 h treatments with NOC (100 nM) (b) and ST-401 (100 nM) (c). Both X and Y axis represent the normalized effect size (normalized β coefficient) relative to vehicle (CTR) in response to treatment. Statistics (b, c): Gray zone shows filtered for significance (from − 0.2 to 0.2). d Bioinformatic analysis using the platform Metascape reveals change in mRNA related to specific cell functions after 24 h treatments with NOC (100 nM) and ST-401 (100 nM) that follow the same and opposite directions. e, f Heatmaps of the union of differentially expressed genes (FDR < 0.05 & abs(βcoefficient) > 0.2) as a function of NOC or ST-401 treatment for 8 h (e) or 24 h (f). Boxes to the right of each heatmap denote significant enriched gene sets for the highlighted gene clusters (FDR < 0.1, hypergeometric test). g UMAP embedding of single-cell transcriptomes of cells exposed to NOC, ST-401 or vehicle (CTR) for 8 h or 24 h faceted by treatment. Cells are colored by cluster and their relative abundance in % of total cells. h. Cell density by condition across the UMAP embedding from g. g Heatmap of the log2 of the odds ratio for the enrichment or depletion of cells across the cell state clusters from CTR treatment. Only statistically significant enrichments are shown (FDR < 0.05, Fisher’s exact test). h Cell density analysis of transcriptomes of cells exposed to NOC, ST-401 or CTR for 24 h. UMAP embedding of single-cell transcriptomes of cells exposed to NOC, ST-401 or vehicle (CTR) for 8 h or 24 h. Colors denote Leiden-based community detection cluster assignments in PCA space as calculated using a mutual nearest neighbor approach clustered cells in PCA space with Leiden-based community detection. i, j Heatmap of the scaled aggregate expression of genes associated with proliferation, hyperploidy and apoptosis for the cell state clusters from h. Rows (clusters) are ordered as in i. Hyperploid and Apoptosis scores were derived from the MSigDB Chemical and Genetic perturbation and the Hallmark gene set collections, respectively

