Fig. 7.
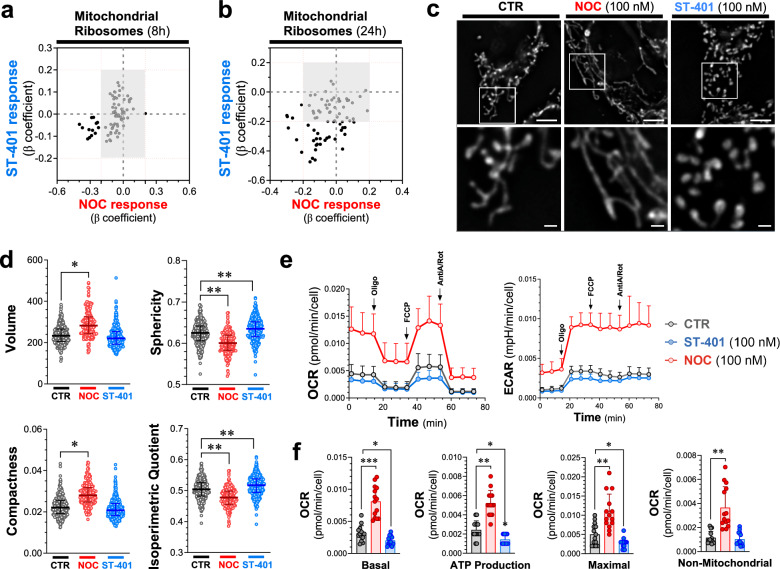
Opposite changes in mitochondrial morphology and OXPHOS induced by NOC and ST-401. a, b Changes in the expression of mRNA coding for mitochondrial ribosomes after 8 (a) and 24 h (b) treatment with NOC (100 nM) or ST-401 (100 nM). The x-axis represents the normalized effect size (normalized β coefficient) relative to vehicle (CTR) in response to treatment. c, d Representative images of HCT116 cells treated for 24 h with vehicle (CTR), NOC (100 nM) or ST-401 (100 nM) and stained with mitoTracker to visualize mitochondria (c). Unbiased quantification of their volume, sphericity compactness and isoperimetric quotient (d). Statistics (d) Data are shown as mean ± s.e.m. of 3 independent experiments. Ordinary one-way ANOVA analysis resulted in * = p < 0.05 and ** = p < 0.01 compared to CTR. e, f Measure of the oxygen consumption rate (OCR) and of extracellular acidity response (ECAR) of HCT116 treated for 24 h with CTR, NOC (100 nM) or ST-401 (100 nM). Treatment with oligomycin (Olig, 1 µM), FCCP (1 µM), antimycinA/rotenone (1 µM) allowed to resolve the mitochondrial health based on the basal OCR, ATP production, maximal OCR response and non-mitochondrial respiration (f). Statistics (f) Data are shown as mean ± s.e.m. of 5 independent experiments. Ordinary one-way ANOVA analysis resulted in * = p < 0.05 and ** = p < 0.01 compared to CTR

