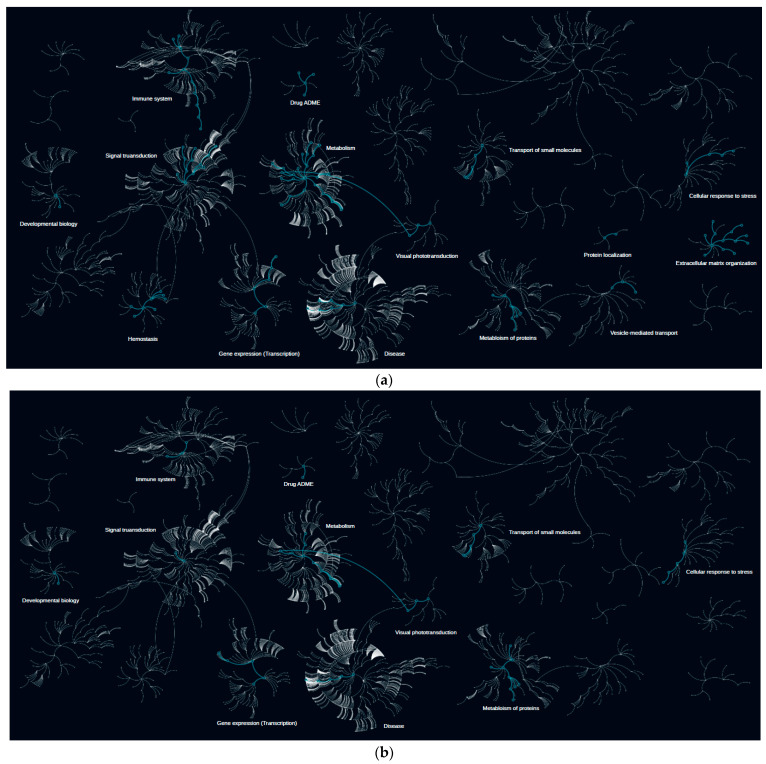
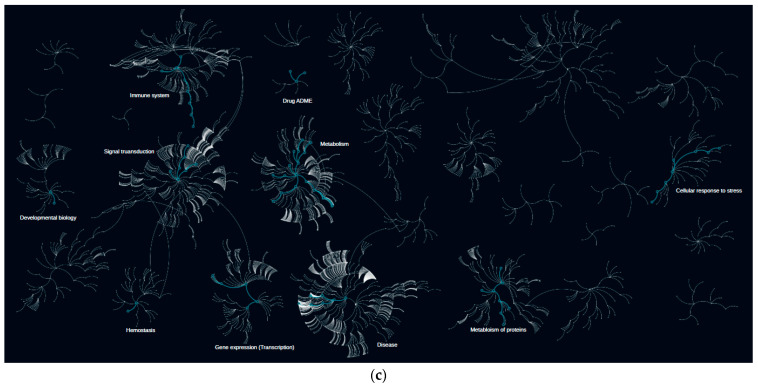
Figure 2.
Pathway-enrichment analysis in the case of differentially expressed proteins. (a) Pathways enriched with proteins altered between control subjects and subjects with type 2 diabetes (T2D); (b) Pathways enriched with proteins altered between control subjects and subjects with obesity; (c) Pathways enriched with proteins altered between subjects with obesity and subjects with T2D. The higher resolution images of the networks are presented in Figure S2.


