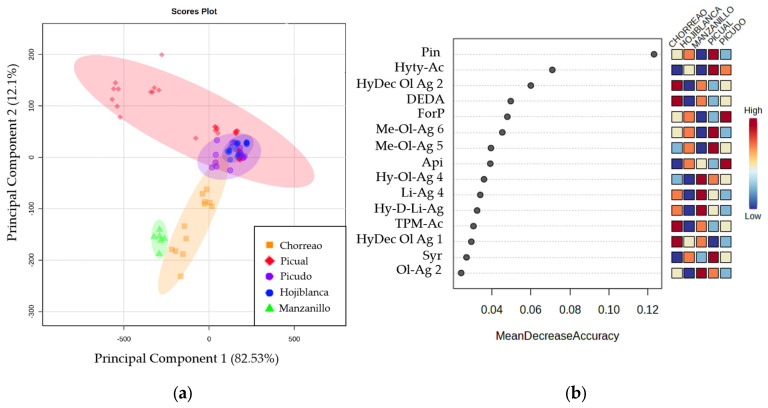
Figure 2.
(a) Two-dimensional Principal Component Analysis plot obtained from studying the compounds quantified in the EVOOs of different varieties: Chorreao (orange), Hojiblanca (blue), Manzanillo (green), Picual (red), and Picudo (purple). (b) Random Forest plot that shows the quantified compounds with the greatest discriminating power between the varieties studied: Chorreao, Hojiblanca, Manzanillo, Picual, and Picudo.

