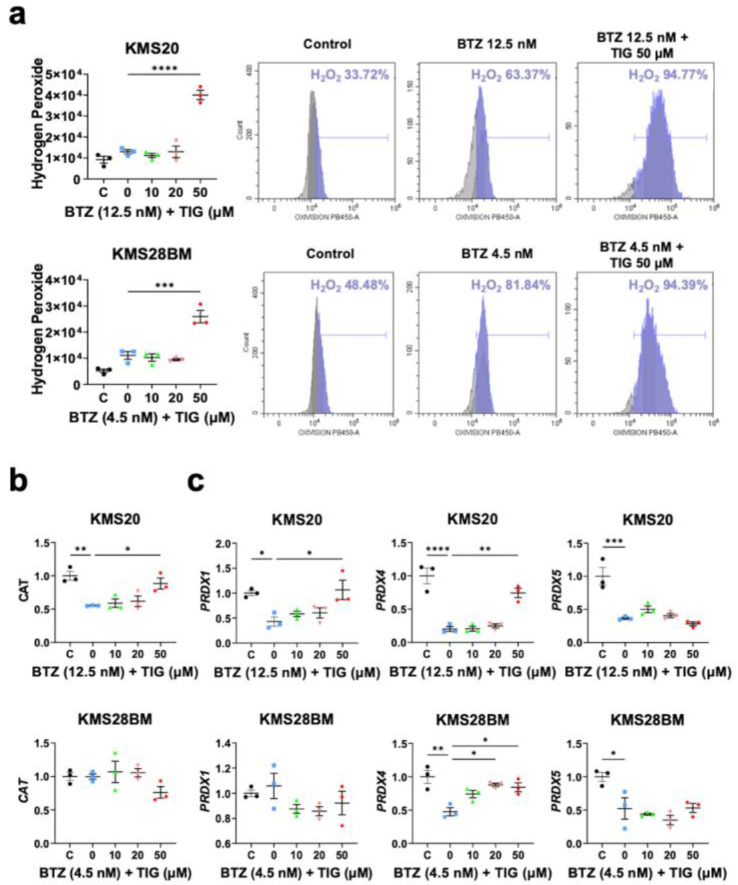
Figure 6.
TIG plus BTZ treatment increases hydrogen peroxide and endoplasmic reticulum peroxiredoxin (PRDX4) expression in KMS20 and KMS28BM cells, while the expression of other H2O2 scavengers is variable, depending on the cell line, or decreases. (a) Hydrogen peroxide analysis by flow cytometry. On the left-hand side, plot representing the mean ± SEM of three experiments (two replicas of each) in KMS20 (top) and KMS28BM (bottom) after 24 h incubation with vehicle (control, C), BTZ EC50 (0) or BTZ EC50 plus the indicated concentration of TIG. *** p < 0.001 and **** p < 0.0001. On the right-hand side, representative flow cytometry analysis for each cell line. (b,c) mRNA expression of genes encoding H2O2 neutralizers analyzed by RT-qPCR as in Figure 4c. Culture conditions for 48 h drug exposure. Plots show means ± SEM of 3 independent experiments. * p < 0.05, ** p < 0.01, *** p < 0.001, and **** p < 0.0001. (b) Plots corresponding to CAT analysis; results of KMS20 cells are shown in the top panels and studies on KMS28BM in the bottom ones. (c) Peroxiredoxins studies (PRDX1, PRDX4, and PRDX5). Plots of data of KMS20 and KMS28BM cells are shown in the top and bottom panels, respectively.

