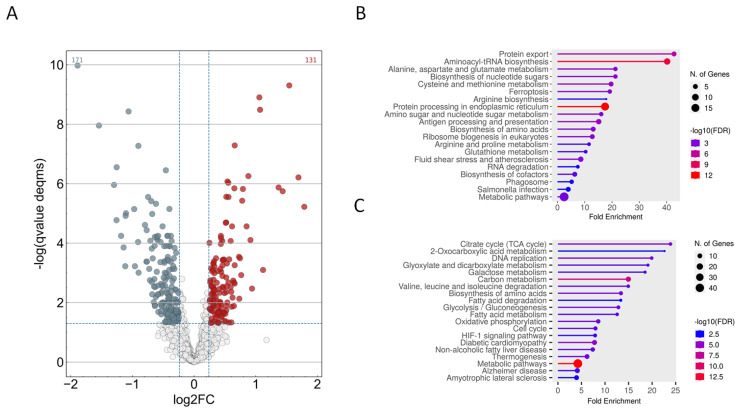
Figure 4.
Proteomics analysis of carnosic acid treated HeLa cells. HeLa cells were treated with 25 μg/mL carnosic acid for 24 h. Five replicates were made and were compared to the untreated control cells. (A), Volcano plot of the upregulated and downregulated proteins in the carnosic acid-treated HeLa cells. (Carnosic acid/control fold change ≥1.18 with q-value < 0.05 (red color); carnosic acid/control fold change ≤1/1.18 with q-value < 0.05 (grey color)). (B), Functional analysis of the upregulated proteins. Graph shows the most significantly altered functional groups/pathways. (C), Functional analysis of the downregulated proteins. Graph shows the most significantly altered functional groups/pathways. Plot sizes for both the up- and downregulated proteins indicate the number of proteins related to a category, and plot color indicates the significance (−log10 FDR) of protein enrichment in a category.

