Figure 1.
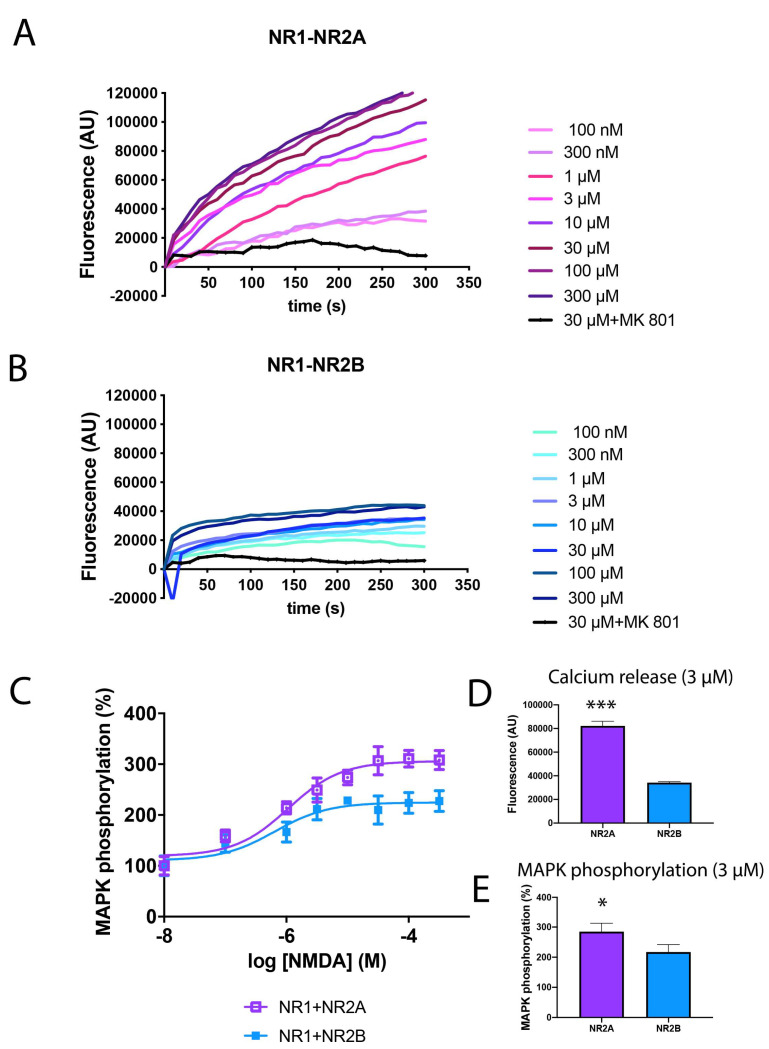
Differential signalling of NR2A or NR2B-containing NMDAR in transfected HEK-293T cells. (A,B,D) HEK-293T cells were transfected with the cDNAs for the NMDAR subunits NR1A (0.6 µg/well), NR2A (0.6 µg/well) (A) or NR2B (0.6 µg/well) (B) and the calcium sensor GCaMP6 (0.5 µg/well). Cells were pre-treated with MK-801 (1 µM) or vehicle and treated with increasing concentrations of NMDA (100 nM to 300 µM). Real-time calcium-induced fluorescence was collected for 300 s. Values are representative curves of 8 independent experiments performed in duplicates. (C,E) HEK-293T cells were transfected with the cDNAs NR1A (0.6 µg/well), NR2A (0.6 µg/well) (violet) or NR2B (0.6 µg/well) (blue). Cells were treated with increasing concentrations of NMDA (10 nM to 300 µM) and ERK1/2 phosphorylation was analysed using an AlphaScreen®SureFire® kit (Perkin Elmer, Waltham, MA, USA). Values are the mean ± S.E.M. of 6 independent experiments performed in triplicates. (D,E) Calcium release and MAPK phosphorylation induced by 3 µM NMDA. Values are the mean ± S.E.M. of 8 independent experiments performed in duplicates. One-way ANOVA followed by Bonferroni’s multiple comparison post hoc test was used for statistical analysis (* p < 0.05, *** p < 0.001 comparing NR2A-containing NMDAR versus NR2B-containing NMDAR).

