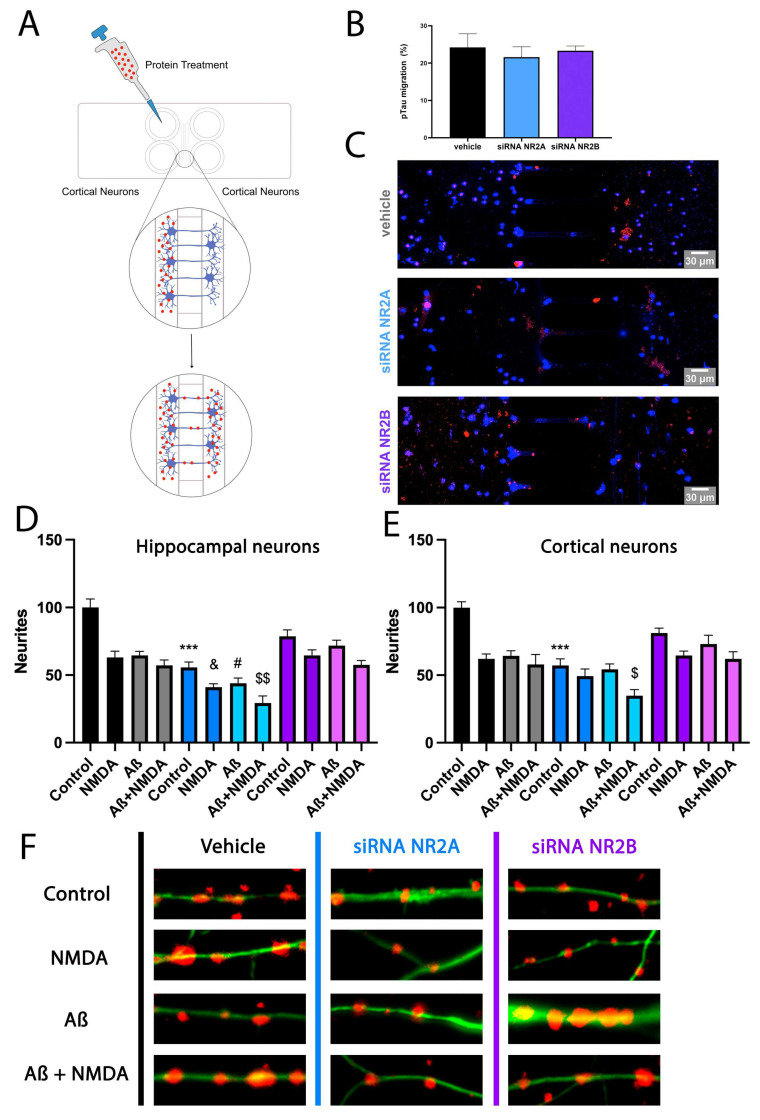
Figure 6.
Effect of NR2A or NR2B-containing NMDAR in pTau migration and neurite patterning in primary cultures of neurons treated with Aβ1-42. (A–C) Mice cortical neurons were grown in microfluidic devices. On DIV 10, neurons were transfected with siRNA for NR2A (blue), siRNA for NR2B (violet) or vehicle (black). On DIV 11, pTau (1 µM) protein was added into compartment A of each device for 24 h. Neurons were labelled with anti-pTau antibody and subsequently with a Cy3 anti-rabbit antibody and imaged in a Zeiss LSM 880. Bar graph shows quantification of the amount of fluorescence in the microfluidic channel opposite the treated channel (Arbitrary Units, A.U.). Values are the mean ± S.E.M. of 5 independent experiments performed in triplicate. One-way ANOVA followed by Bonferroni’s showed no significance. Scale bar 30 μm. (D–F) On DIV 10, cortical and hippocampal primary cultures of neurons were transfected with siRNA for NR2A (blue), siRNA for NR2B (violet) or vehicle (black). Then, 24 h after, cells were treated with Aβ1-42 (500 nM) for 48 h and subsequently stimulated with vehicle or NMDA (15 µM) for 24 h. Neurite patterning was detected by immunocytochemistry using an anti-Nectin antibody (Abcam, 1/1000). Neurons were detected with the 3 anti-F-actin antibody fused to an Alexa 488 fluorophore (ThermoFisher, 1/400). Cell nuclei were stained with Hoechst (blue). Quantification was performed over segments of 15 μm. Each red dot represents a neurite formation. Values are the mean ± S.E.M. of 10 independent experiments performed in duplicates. One-way ANOVA followed by Bonferroni’s multiple comparison post hoc test was used for statistical analysis *** p < 0.001 versus vehicle treatment in control cells, & p < 0.05 versus NMDA treatment in control cells, # p < 0.05 versus Aβ1-42 treatment in control cells and $ p < 0.05, $$ p < 0.01 versus Aβ1-42 and NMDA treatment in control cells.

