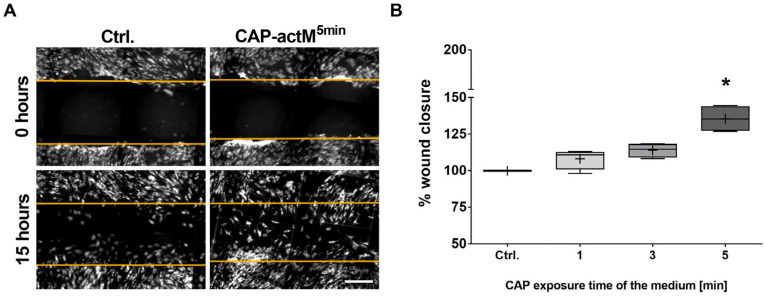
Figure 5.
Analysis of the migratory activity of adMSCs after 1 day with a single treatment with CAP-activated medium. (A) Representative microscopic images of untreated adMSCs and adMSCs treated with CAP-activated medium immediately after scratching (i.e., at 0 h) and 15 h thereafter (the orange lines mark the respective boundaries of the original scratch area). (B) Quantification of wound closure via image analyses (quantification of cell overgrowth was 15 h after scratching, scale bar: 100 µM; Shapiro–Wilk test indicated Gaussian distribution; statistical significance was calculated using a two-way ANOVA with Dunnett’s multiple comparison post hoc test; * p < 0.05 significant compared to the control, n = 4).

