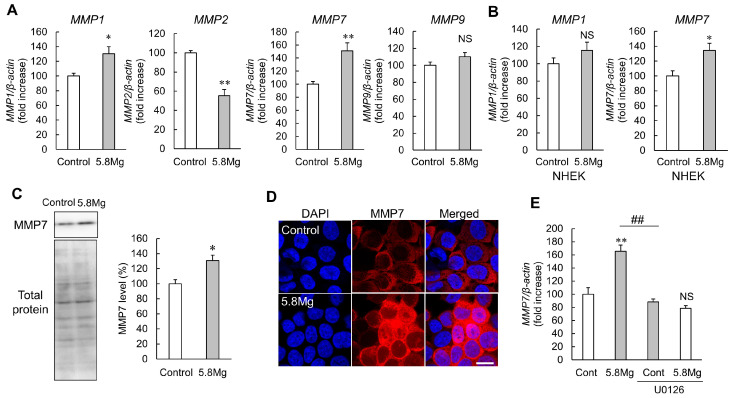
Figure 4.
Effect of Mg2+ on MMPs expression. (A) HaCaT cells were cultured with DMEM containing 0.8 mM MgCl2 (Control) and 5.8 mM MgCl2 (5.8Mg) for 8 h. RT-PCR analysis showed the mRNA levels of MMP1, MMP2, MMP7, MMP9, and β-actin. (B) NHEK cells were cultured with Control and 5.8 Mg for 6 h. RT-PCR analysis showed the mRNA levels of MMP1, MMP7, and β-actin. (C) HaCaT cells were cultured in serum-free medium supplemented with Control and 5.8 Mg for 24 h. Western blotting analysis showed the protein level of MMP7. n = 4. ** p < 0.01, * p < 0.05, NS p > 0.05 vs. Control. (D) HaCaT cells were cultured on a cover glass with Control and 5.8Mg for 24 h. The cells were observed using confocal laser microscopy after staining with anti-MMP7 antibody (MMP7, red) and DAPI (nuclear, blue). Scale bar = 10 µm. (E) HaCaT cells were cultured with Control and 5.8 Mg with/or without 20 µM U0126 for 8 h. RT-PCR analysis showed the mRNA levels of MMP7 and β-actin. n = 3–4. ** p < 0.01, NS p > 0.05 vs. Control. ## p < 0.01 vs. 5.8 Mg.

