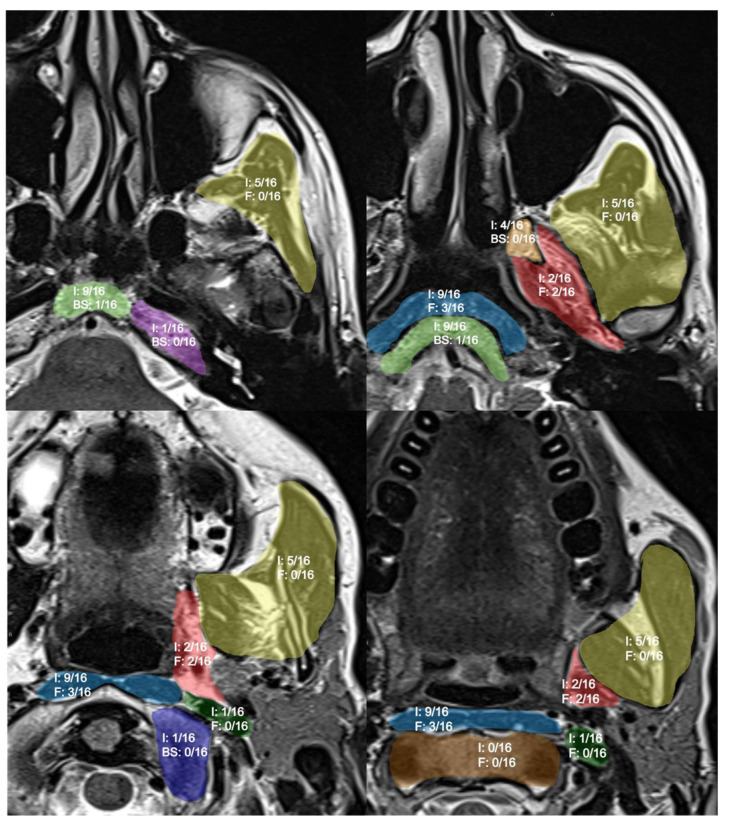
Figure 1.
Pictorial representation of findings after NER. I: inflammatory changes; F: fibrosis; BS: bone sclerosis. Anatomical subsites are highlighted with different colors: masticator space in yellow; prevertebral space in light blue; carotid space in dark green; parapharyngeal space in red. Skull base subsites highlighted: clivus in light green; the base of pterygoid processes in orange; atlo-occipital joint in blue; petrous apex in purple; second cervical vertebrae in brown.

