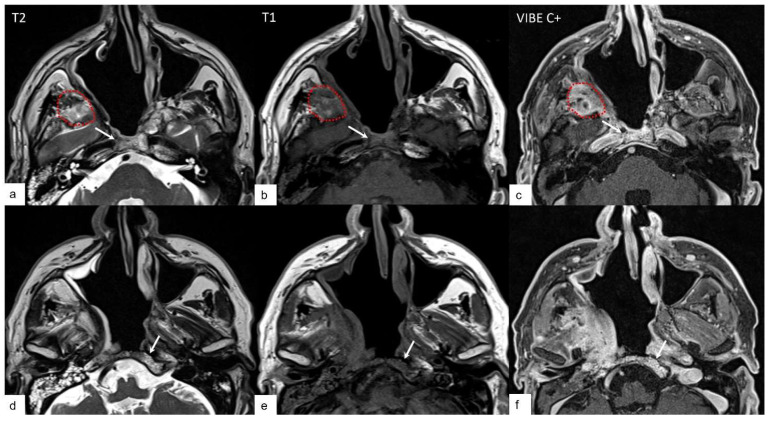
Figure 2.
Expected findings in deep neck spaces and skull base bones: inflammatory changes. An example of bone edema in the clivus is denoted by the white arrow highlighting hyperintense T2 signal (a,d), hypointense T1 signal (b,e) and enhancement after contrast medium injection (c,f) in the bone marrow of the clivus; the red dotted line is encompassing an inflammatory change in the masticator space (hyperintense in T2-weighted sequence, hypointense in T1-weighted sequence and enhancement after contrast agent).

