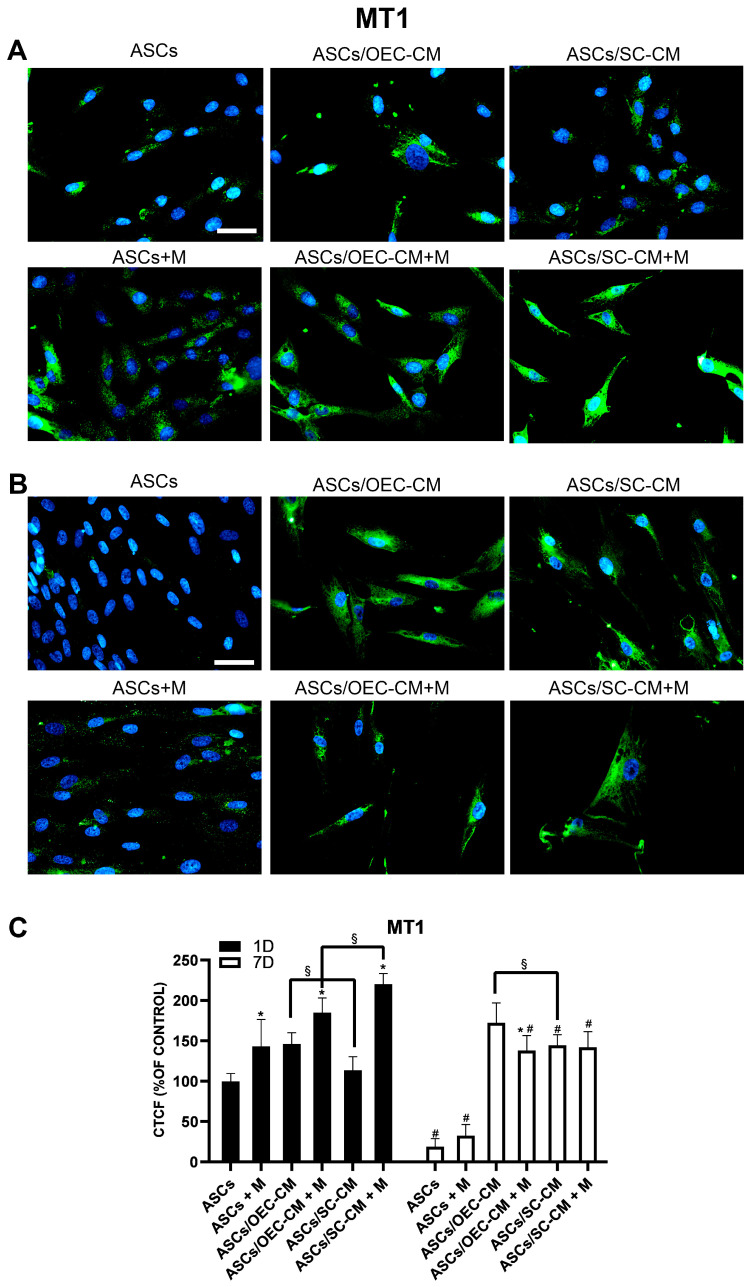
Figure 7.
MT1 expression in ASC cultures. The different conditions were investigated by immunocytochemistry after 1 (A) and 7 (B) days of culture. Quantitative immunofluorescence data (ImageJ) are reported in panel (C). The basal MT1 expression detectable on day 1 in control ASCs almost disappears on day 7, showing at both time points an increase after melatonin addition. OEC-CM treatment also increased MT1 expression, especially on day 7; in combination with melatonin, a further increase was obtained on day 1, whereas lesser increases were observed on day 7. On the other hand, SC-CM treatment produced no significant MT1 expression modifications on day 1, whereas an increase was observed on day 7; in combination with melatonin, a robust increase in MT1 expression was visible on day 1, whereas no appreciable modification was detected on day 7. Blue fluorescence counterstaining indicates cell nuclei. Scale bars: 50 µm. Quantitative data reported in the histogram of panel (C) confirm MT1 expression modifications above described. Each plot in panel (C) summarizes a total of 60 measurements. * p < 0.05 melatonin presence vs. corresponding melatonin absence; # p < 0.05 day 7 vs. day 1; § p < 0.05 OEC-CM vs. SC-CM with or without melatonin.

