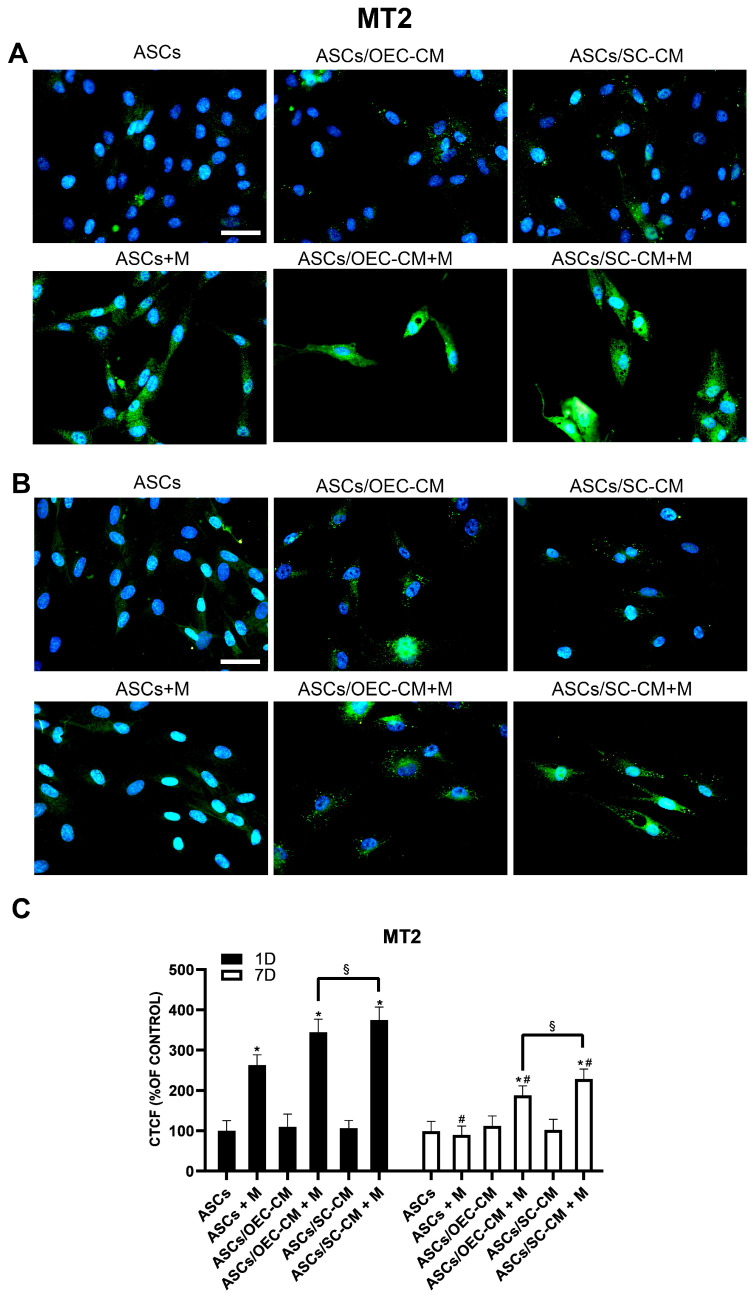
Figure 8.
MT2 expression in ASC cultures. The different conditions were investigated by immunocytochemistry after 1 (A) and 7 (B) days of culture. Quantitative immunofluorescence data (ImageJ) are reported in panel (C). The basal MT2 expression detectable on day 1 when ASCs are grown in their basal medium is significantly increased when melatonin is present, whereas the same basal levels are unmodified on day 7, notwithstanding melatonin. At both detection times, no evident changes could be obtained following both CM treatments. In combination with melatonin, a significant enhancement of MT2 expression was observed, especially on day 1. Blue fluorescence counterstaining indicates cell nuclei. Scale bars: 50 µm. Quantitative data reported in the histogram of panel (C) confirm the MT2 expression modifications above described. Each plot in panel (C) summarizes a total of 60 measurements. * p < 0.05 melatonin presence vs. correspondent melatonin absence; # p < 0.05 day 7 vs. day 1; § p < 0.05 OEC-CM vs. SC-CM with or without melatonin.

