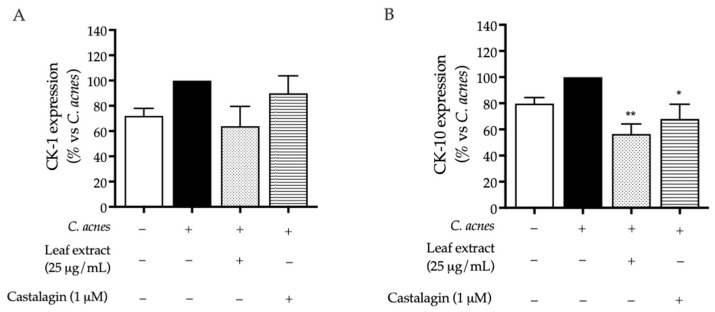
Figure 5.
Effect of the leaf extract from C. sativa and castalagin on CK-1 (A) and CK-10 (B) expression, measured via ELISA. The HaCaT cells (not stimulated control, white bar) were treated with C. acnes O.D. = 0.1 (black bar) and the leaf extract (dots bar) or castalagin (horizontal lines bar) for 48 h. Data (n = 3) are expressed as the mean (%) ± SEM relative to C. acnes, which was arbitrarily assigned the value of 100%. * p < 0.05 and ** p < 0.01 vs. C. acnes.

