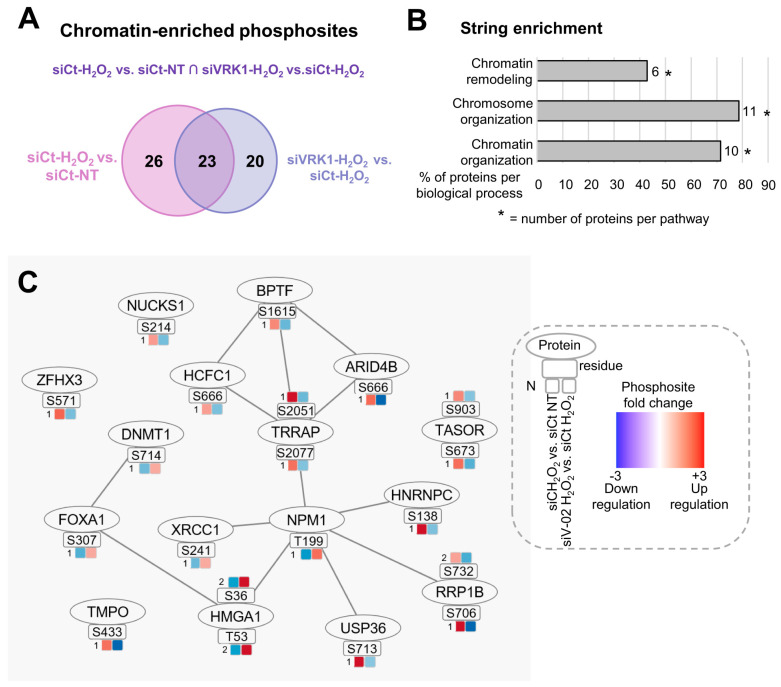
Figure 8.
Overlapping significant chromatin-enriched phosphosites altered by both hydrogen peroxide treatment and VRK1 depletion in A549 lung adenocarcinoma cells. (A) Venn diagram representing the number of differentially phosphorylated phosphosites in each comparison and their intersection (used to build network in (C)). Numbers indicate unique or common genes (overlap) in each condition (circles). (B) Bar graph containing STRING enrichment of the proteins from B based on GO terms. (C) Protein–protein interaction (PPi) network showing overlapping significant phosphosites and proteins with fold changes (colored squares) of two group comparisons: H2O2-siControl vs. non-treated-siControl, and H2O2-siVRK1-02 vs. H2O2-siControl. N means the fold change. Nuclei isolation and knockdown controls are shown in Supplementary Figure S3. Heatmap containing the normalized phosphosite intensity of each replicate from each group is shown in Supplementary Figure S4. ∩ = intersection.

