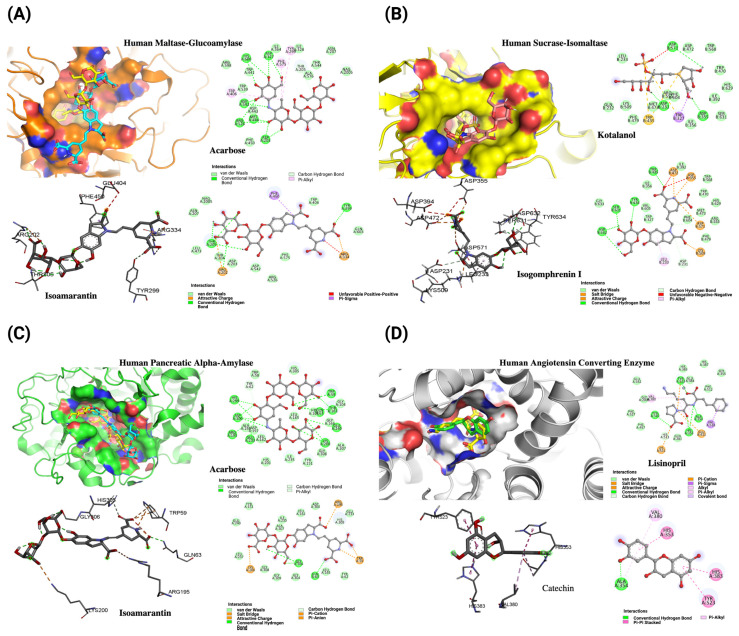
Figure 6.
Structural and interaction analysis of key human enzymes with inhibitors, accompanied by 2D interaction diagrams. (A) Maltase-glucoamylase bound with acarbose (yellow) and isoamaranthin (−9.1 kcal/mol, cyan). (B) Sucrase-isomaltase interaction with kotalanol (yellow) and isogomphrenin-I (−9.0 kcal/mol, salmon). (C) Pancreatic alpha-amylase complexed with acarbose (yellow) and isoamaranthin (−11.9 kcal/mol, cyan). (D) Angiotensin-converting enzyme complexed with lisinopril (yellow) and catechin (−9.9 kcal/mol, green).

