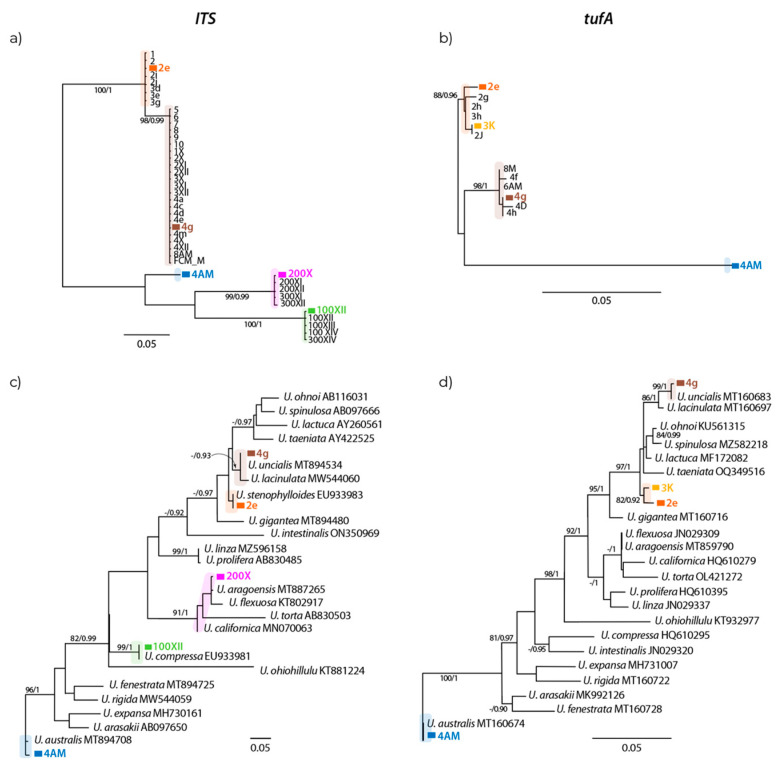
Figure 11.
Maximum Likelihood phylograms of ITS1 and tufA sequences of Ulva from Algarrobo Bay ((a,b), respectively) and for the same markers including sequences from GenBank of other Ulva species (c,d). Support values of nodes correspond to Maximum Likelihood bootstrap values greater than 80% and Bayesian posterior probabilities greater than 0.9; “-” indicates lower values. Branches without support values have bootstrap values lower than 80% and posterior probabilities lower than 0.9. Colors designate different morphs.

