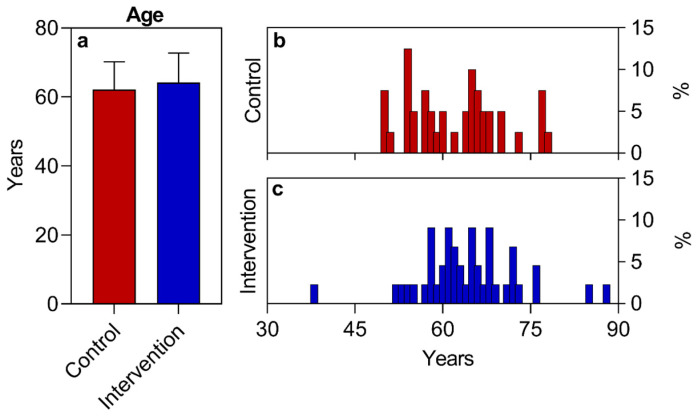
Figure 3.
Age of study participants. Summarization of age by study group (control or intervention) (a) and descriptive histogram of the percentage of participants by age in the control (b) and intervention (c) groups. Data are presented as mean ± standard deviation. There is no significant difference between the age values presented by the control and intervention groups (unpaired t-test; p > 0.05).

