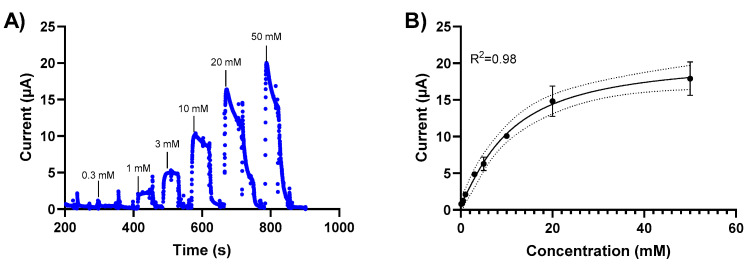
Figure 3.
Glucose level-dependent changes in the current response of the NH2-Fc-functionalized prGOx/BSA/GA sensor. (A) Chronoamperometric response of the NH2-Fc-functionalized prGOx/BSA/GA sensor at 0.2 V in PBS obtained with the successive addition of glucose from 0 to 50 mM. (B) Calibration dose–response curve derived from the amperometric signal response. The graph shows a linear response for glucose concentrations between 0 and 20 mM and the saturation for concentrations higher than 20 mM of glucose. Data represented here are from n = 2 replicates.

