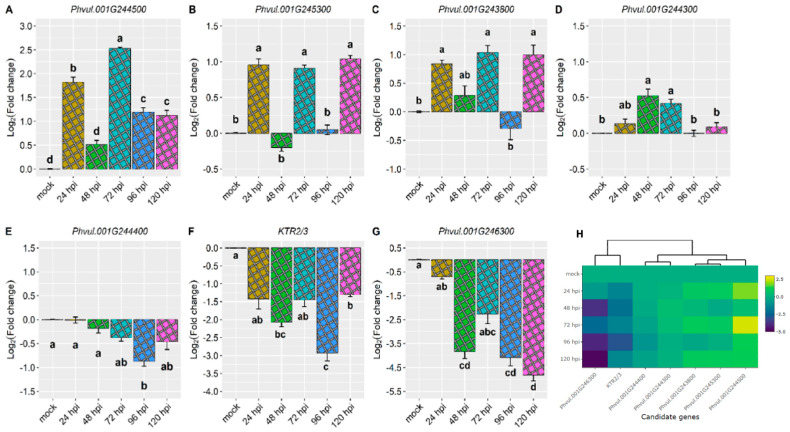
Figure 2.
Relative expression of candidate genes (A) Phvul.001G244500, (B) Phvul.001G245300, (C) Phvul.001G243800, (D) Phvul.001G244300, (E) Phvul.001G2444400, (F) KTR2/3, (G) Phvul.001G246300 in the Amendoim Cavalo at 24, 48, 72, 96, and 120 h post-inoculation (hpi) with the race 73 of C. lindemuthianum and mock. The results are presented as logarithmic base 2 of the fold change of gene expression. Means with the same letter for each gene are not significantly different at the 5% significance level, using the Alexander–Govern test. (H) Heatmap of the relative expression of candidate genes for the Co-AC and genes proximal to this locus in the Amendoim Cavalo cultivar. Yellow shading indicates higher expression, and dark blue shading has lower expression than reference genes.

