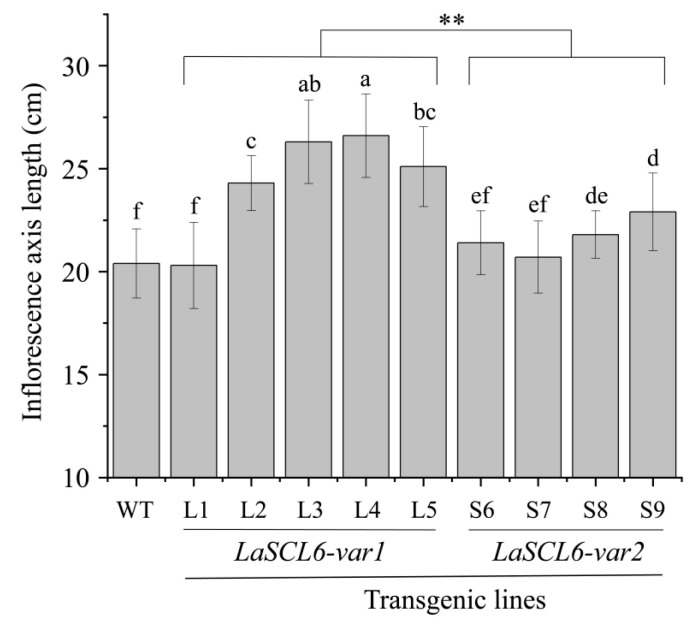
Figure 7.
Statistical diagram of inflorescence axis lengths of wild-type (WT) and transgenic Arabidopsis thaliana. The differences between each line were analyzed using LSD, p ≤ 0.05, indicated by lowercase letters. Student’s t-tests were used to compare LaSCL6-var1 and LaSCL6-var2 groups, p ≤ 0.01, and ** was used.

