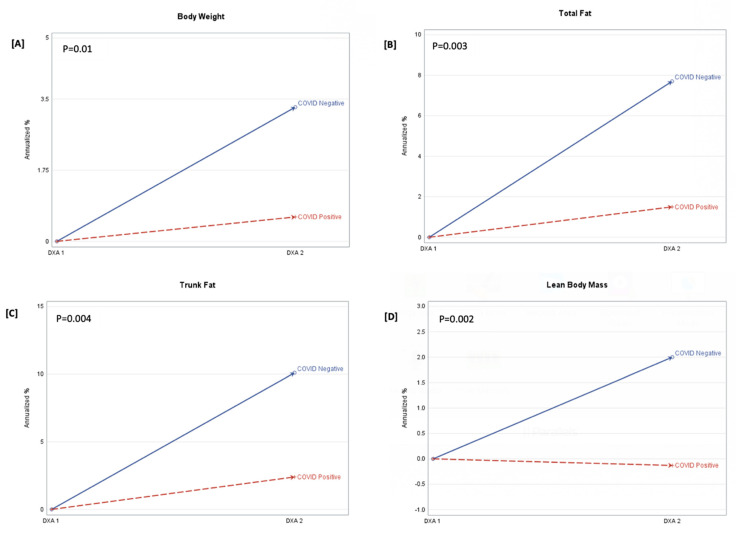
Figure 1.
Annualized percentage (%) change in body weight, total fat, trunk fat, and lean body mass. FOOTNOTE: Annualized percentage (%) change (APC) = (annualized change/DXA1)*100. p-value is the between-group probability. The derived APC is shown at DXA 1(baseline) and DXA 2, stratified by the COVID-19-negative and COVID-19-positive groups. Panel (A) is the APC in body weight (kg), panel (B) is the APC in total fat (g), panel (C) is the APC in trunk fat (g), and panel (D) is the APC in lean body mass (g).

