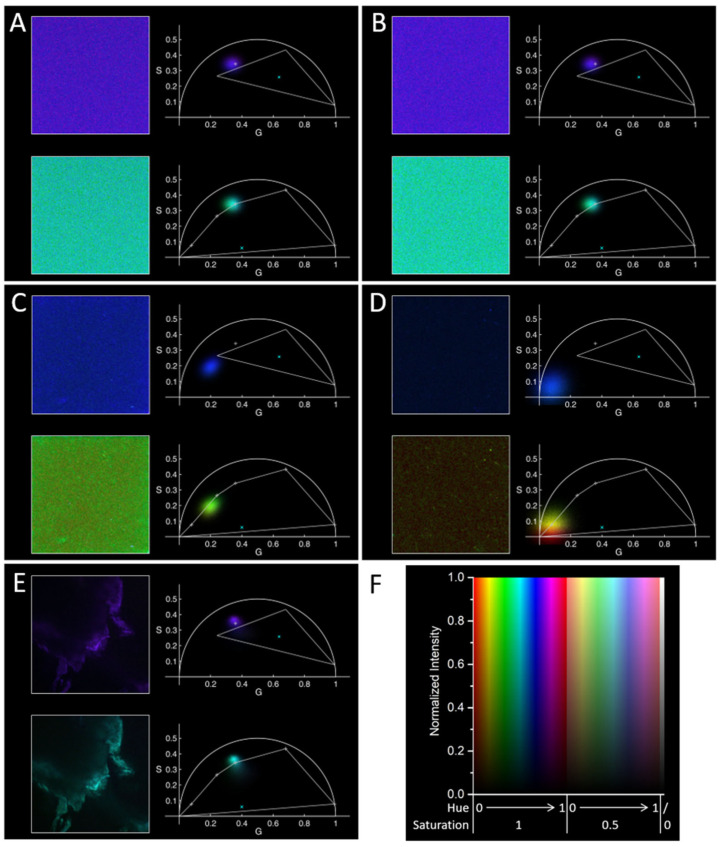
Figure 2.
Characterization of empty PLGA nanoparticles and PGZ-loaded PLGA NPs using FLIM. For each panel, on the left are reported the FLIM images and on the right the phasor plots (with corresponding colors) for exemplary cases for NPs (A–D) and for solid PLGA (E): (A) empty PLGA NPs in RPMI, (B) PGZ-loaded PLGA NPs in RPMI, (C) empty PLGA NPs in PBS, (D) PGZ-loaded PLGA NPs in PBS, (E) solid PLGA. A linear scale was used for the intensity normalized to the maximum in each picture (like on top in Figure 1; color scale reported in panel (F)). Two color codes were used, one like in Figure 1 (top figures in each panel), one with additional principal points (see main text), as shown in the right bottom figure in each panel (vertices of the polygon and light gray crosses), with hue of 0/1 at (0,0) and increasing clockwise, and a “center” point (cyan ×) inside but towards the bottom of the polygon.

