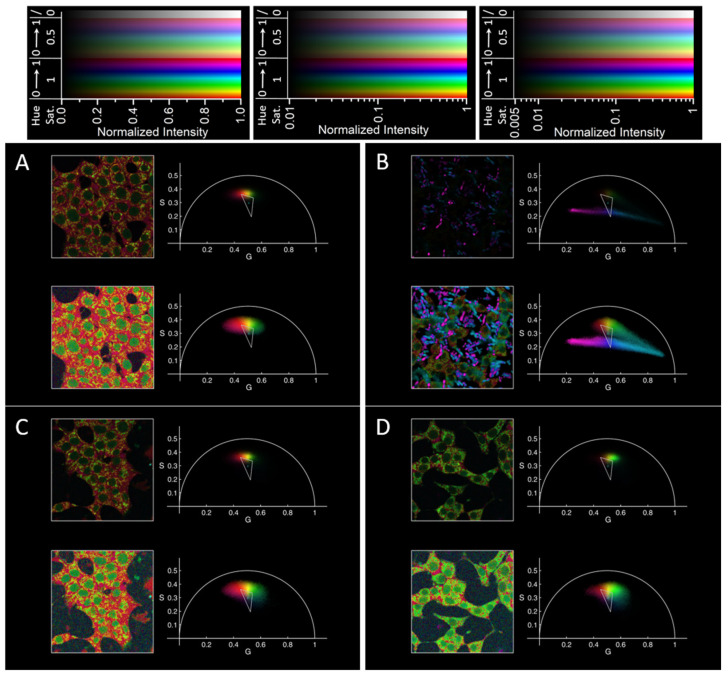
Figure 4.
FLIM characterization of INS-1E cells interacting with PGZ and with the nanoparticles considered in this work. The same data of Figure 3C–F are here reported with a different color encoding for phasor position (principal points at the vertices of the triangle and center point in cyan in the right part of each panel), in order to better appreciate the position of phasors characterizing fluorescence arising from within the cells. (A) INS-1E in RPMI, (B) INS-1E in RPMI in the presence of PGZ, (C) INS-1E in RPMI in the presence of empty PLGA NPs, (D) INS-1E in RPMI in the presence of PGZ-loaded PLGA NPs. For each panel: on the left, FLIM images; on the right, phasor plots with corresponding colors; on the top, a linear intensity scale is used (the most on the left on the top of the figure), on the bottom a logarithmic one starting from 1% (panels (A,C,D), center color scale on top of the figure) or from 0.5% (panel (B), rightmost color scale on the top of the figure) of the maximum intensity in each image. Note that, on average, the apparent intensities of cells in the bottom image of panel (B) are similar to the ones on the top images in the other panels.

