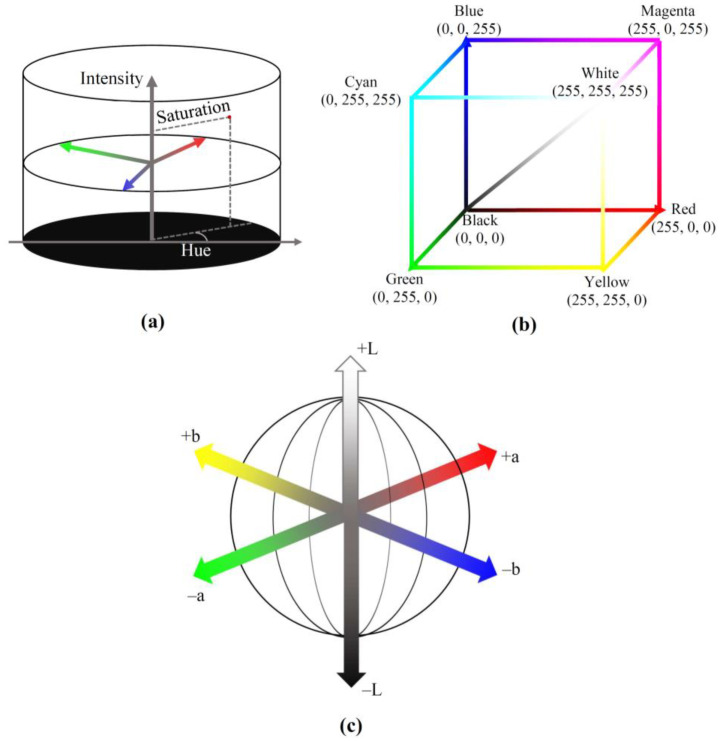
Figure 1.
Schemes of HSI (hue, saturation, intensity) (a); RGB (red, green, blue) (b); and L*a*b* (brightness, red-green, yellow-blue) (c) color models. Typical range of R, G, and B (from 0 to 255) is shown. The L*a*b* and L*u*v* color models are initially proposed for the industrial application of colors. These spherical models include the normalized brightness axis (L*) and red–green (a* or u*) and yellow–blue (b* or v*) chromatic axes (Figure 1c) [59]; all coordinates are calculated based on X, Y, and Z (see above) and X0, Y0, and Z0, which are values of X, Y, and Z using the white reflectance calibration standard (Table 1). The combination of these chromatic coordinates determines all colors [61,62]. The system L*c*h* is based on other color components, including the brightness, chroma, and hue [61], which are calculated based on L*, a*, and b* in the L*a*b* model (Table 1).

