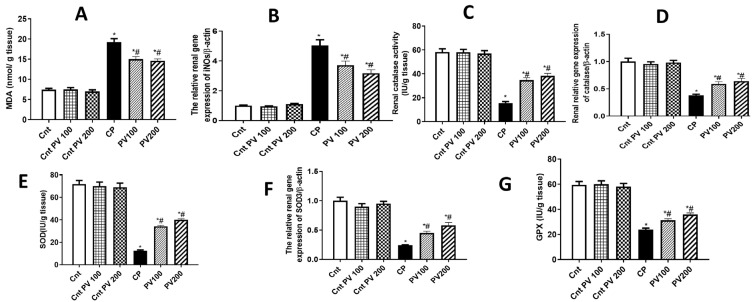
Figure 6.
Treatment with PV protected against CP-induced renal oxidative stress as revealed by oxidative stress parameters ((A) MDA levels and (B) iNOs expression) and activities of the antioxidant enzymes ((C) CAT, (E) SOD, and (G) GPx) and their related genes ((D) CAT and (F) SOD3). Data were expressed as mean ± SEM (n = 7). * Moreover, # represents a significant difference at p < 0.05 against the control (Cnt) and cisplatin (CP) groups. PV100, low dose papaverine-treated group; PV200, high dose papaverine-treated group.

