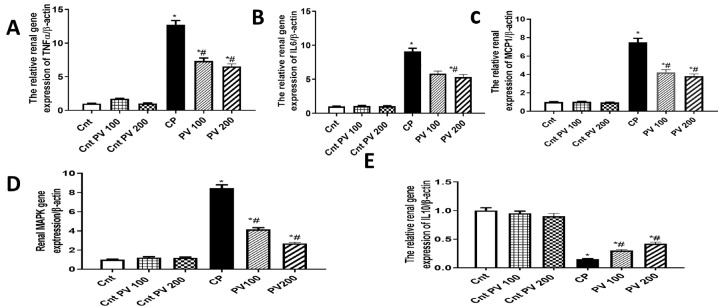
Figure 7.
The impact of PV and/or CP on the expression of inflammation-related genes ((A) TNFα, (B) IL6, (C) MCP1, (D) MAPK1, (E) IL10) in kidney tissues as determined by qPCR. Data were expressed as mean ± SEM (n = 5). * Moreover, # represents a significant difference at p < 0.05 against the control (Cnt) and cisplatin (CP) groups. PV100, low dose papaverine-treated group; PV200, high dose papaverine-treated group.

