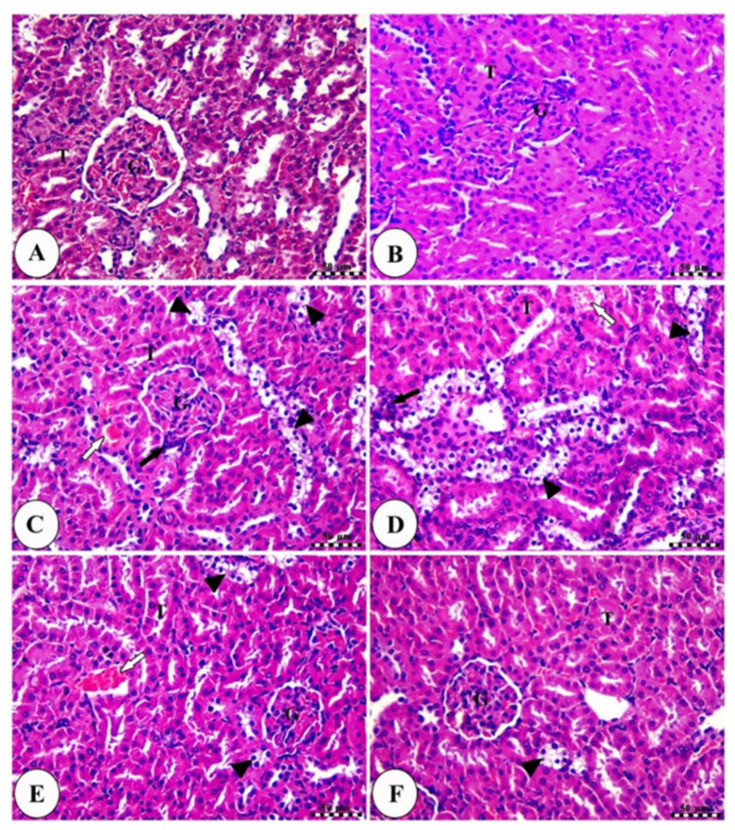
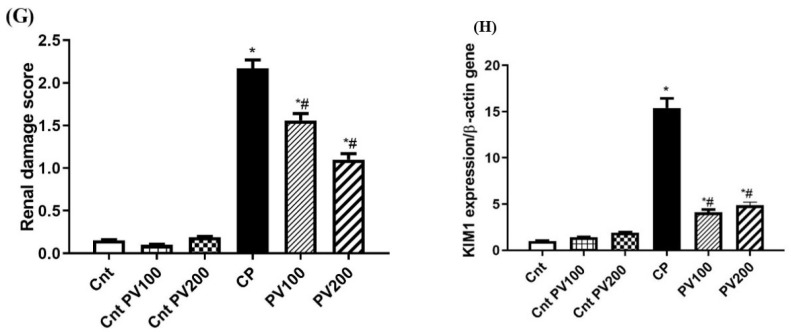
Figure 9.
Photomicrographs of kidney sections in the normal control group (A), the control PV200 group (B), the CP group (C,D), the PV100-treated group (E), and the PV200-treated group (F). All slides were stained with H&E, scale bars = 50 µm. All labels (arrows and arrowheads) were explained in the main text. (G) Renal damage score. (H) The effect of PV on KIM1 gene expression. Data were presented as mean ± SEM. * Moreover, # represents a significant difference against the control and cisplatin groups. Cnt: Control, CP: cisplatin, PV: papaverine.


