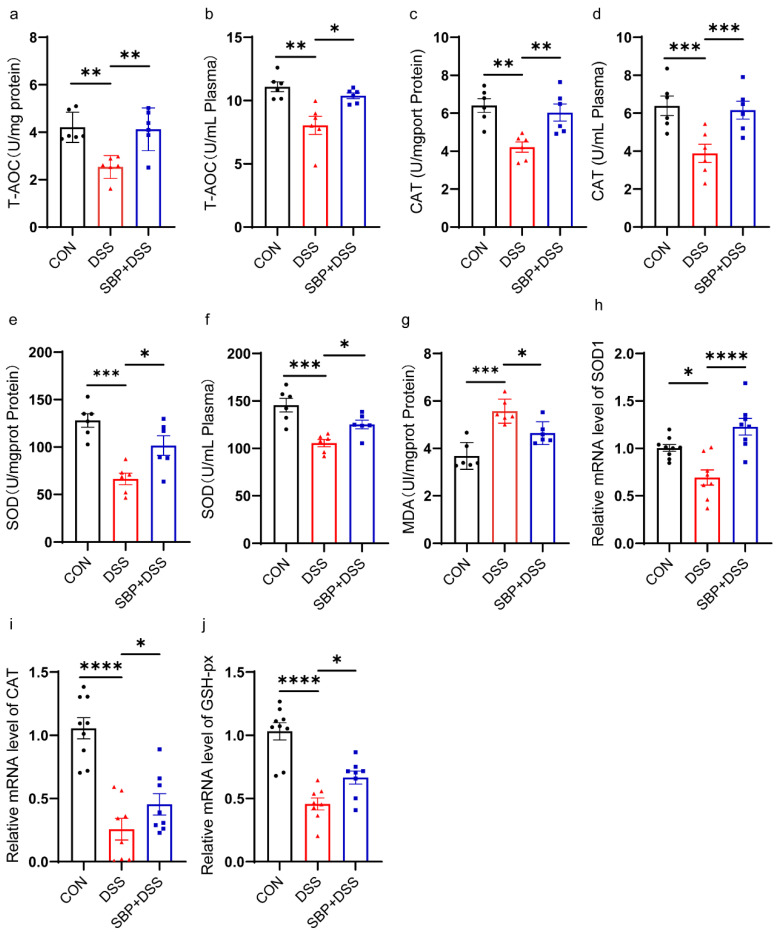
Figure 4.
Prophylactic SBP attenuated oxidative stress. Capability of T-AOC in colon (a) and in plasma (b) (n = 6). Activity of CAT in colon (c) and in plasma (d) (n = 6). Activity of T-SOD in colon (e) and in plasma (f) (n = 6). (g) Concentrations of MDA in the colon (n = 6). The relative expression of antioxidation related gene in the colon. (h) SOD1; (i) CAT; (j) GSH-px (n = 8–10). **** p ≤ 0.0001, *** p ≤ 0.001, ** p ≤ 0.01, * p ≤ 0.05.

