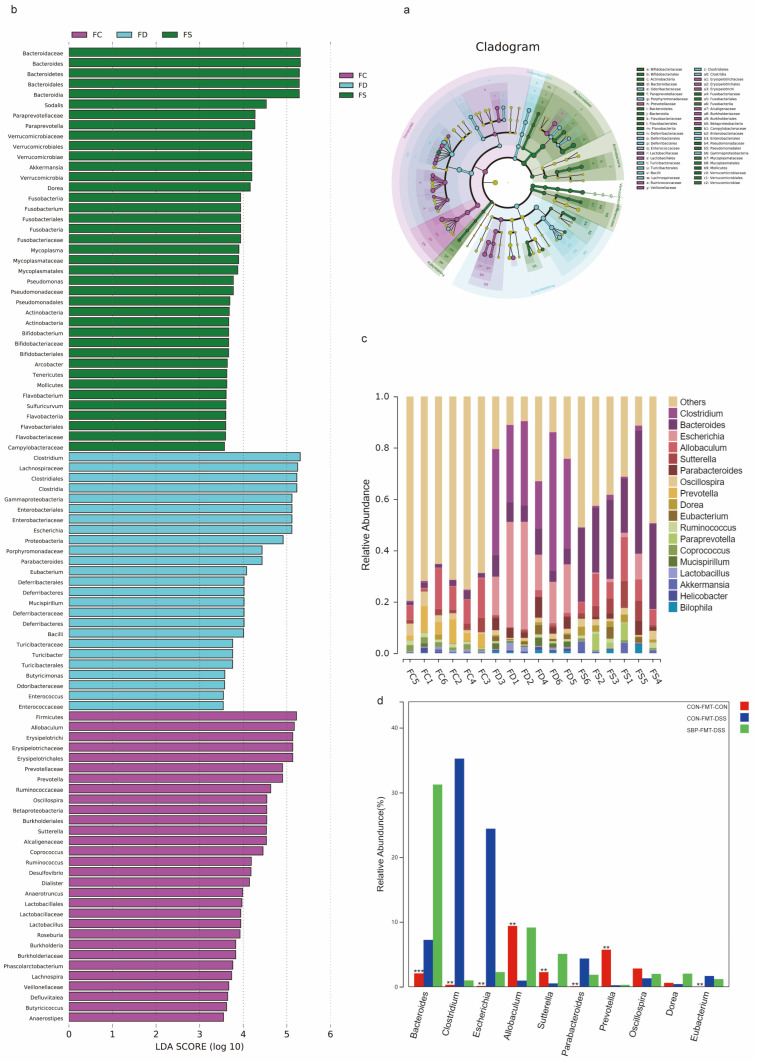
Figure 14.
SBP-FMT altered gut microbial composition and structure. (a) LEfSe analysis illustrating the microbial features. (b) LDA score based on LEfSe analysis. (c) Main microbiota at the genus level of each sample. (d) Difference of microbiota at the genus level among groups. ** p ≤ 0.01, *** p ≤ 0.001.

