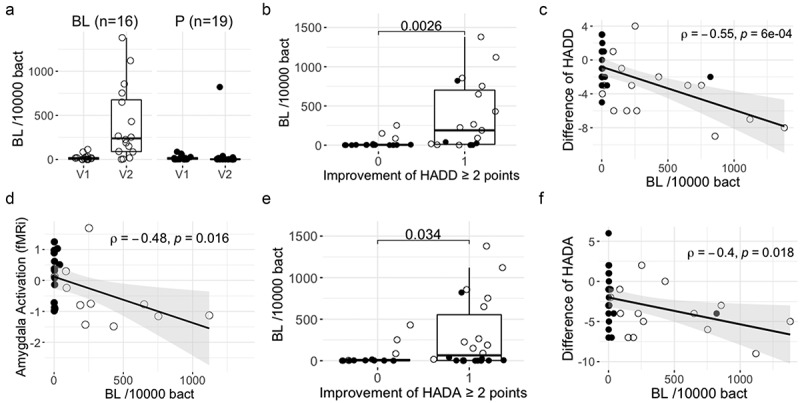
Figure 1.

Fecal BL NCC3001 relative abundance and associations with clinical outcomes.
A) BL NCC3001 abundance in feces at baseline (V1) and at the end of intervention (V2) per group. B) Fecal BL NCC3001 abundance in responders [≥2 points improvement in HADD score (1)] and not responders [<2 points improvement in HADD score (0)]; p-value of Wilcoxon test. C) Correlation between the difference of HADD score (V2-V1) and BL NCC3001 abundance at V2; Spearman test. D) Correlation between amygdala activation (fMRi) and BL NCC3001 abundance at V2; Spearman test. E) Fecal BL NCC3001 abundance in responders [≥2 points improvement in HADA score (1)] and non-responders [<2 points improvement in HADA score (0)]; p-value of Wilcoxon test. F) Correlation between the difference in HADA score (V2-V1) and BL NCC3001 abundance at V2; Spearman test. BL NCC3001 (BL, open circle); Placebo (P, closed circle).
