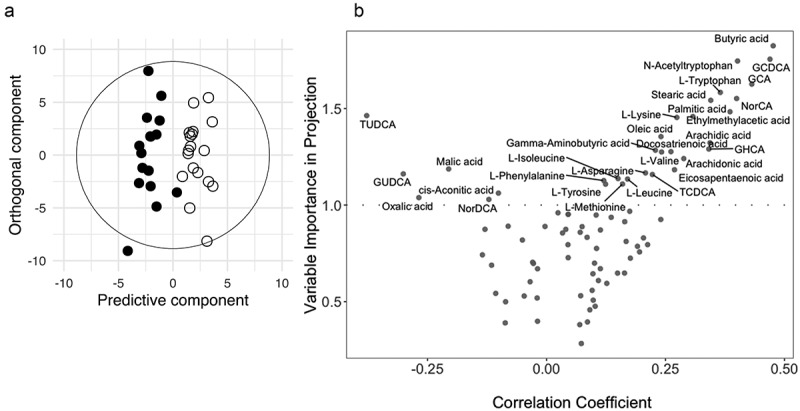
Figure 2.

OPLS samples and variable plots.
(A) OPLS Score plot derived from plasma metabolic profiles. The cross-validated scores plot showed statistically significant separations between the blood profiles obtained post-intervention from placebo (closed circle) and BL NCC3001 (open circle) treated patients. (B) OPLS variables plots describing influential variables contributing to the separation observed in the scores plots, according to variable importance in projection (threshold >1.0) and the correlation coefficient.
